Figures & data
Figure 1. Effect of 100 mg/kg sodium ascorbate on hepatic gene expression of Nrf2 (A). Effect of 50, 100 and 250 μM sodium ascorbate and cisplatin on the gene expression of Nrf2 (B) in HepG2. *Significant difference when compared with the control group of HepG2 cells at p < .05. #Significant difference when compared with the HCC group or HepG2 cells treated with cisplatin at p < .05.
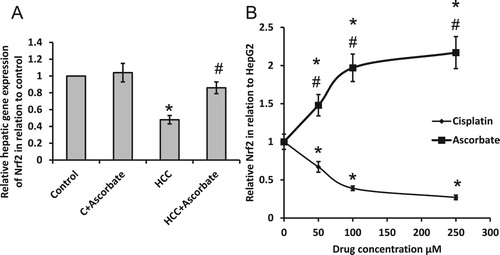
Figure 2. Effect of 100 mg/kg sodium ascorbate on hepatic hydrogen peroxide (A) and hepatic superoxide anion (C) in vivo. Effect of 50, 100 and 250 μM sodium ascorbate and cisplatin on the concentration of hydrogen peroxide (B) and superoxide anion (D) in HepG2. * Significant difference when compared with the control group or HepG2 cells at p < .05. #Significant difference when compared with the HCC group or HepG2 cells treated with cisplatin at p < .05.
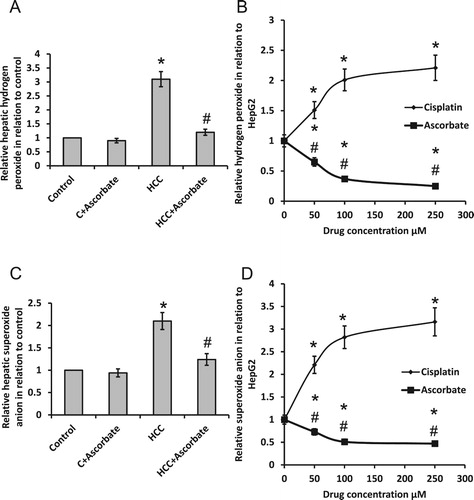
Figure 3. Effect of 100 mg/kg sodium ascorbate on relative hepatic gene expression of NFκB (A) and TNF-α level (C) in vivo. Effect of 50, 100 and 250 μM sodium ascorbate and cisplatin on the gene expression of NFκB (B) and TNF-α level (D) in HepG2. *Significant difference when compared with the control group or HepG2 cells at p < .05. #Significant difference when compared with the HCC group or HepG2 cells treated with cisplatin at p < .05.
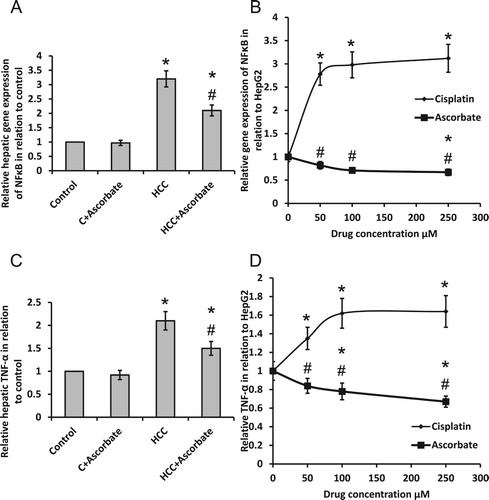
Figure 4. Effect of 100 mg/kg sodium ascorbate on hepatic gene expression of caspase-3 (A), caspase-8 (C) and caspase-9 (E) in vivo as well as the hepatic enzyme activity of caspase-3 (B), caspase-8 (D) and caspase-9 (F). *Significant difference when compared with the control group at p < .05. # Significant difference when compared with the HCC group at p < .05.
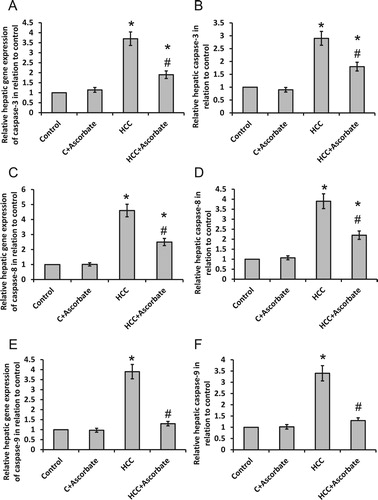
Figure 5. Effect of 50, 100 and 250 μM sodium ascorbate and cisplatin on the activity of caspase-3 (A), caspase-8 (B) and caspase-9 (C) in HepG2. *Significant difference when compared with HepG2 cells at p < 0.05. #Significant difference when compared with cisplatin-treated HepG2 cells at p < .05.
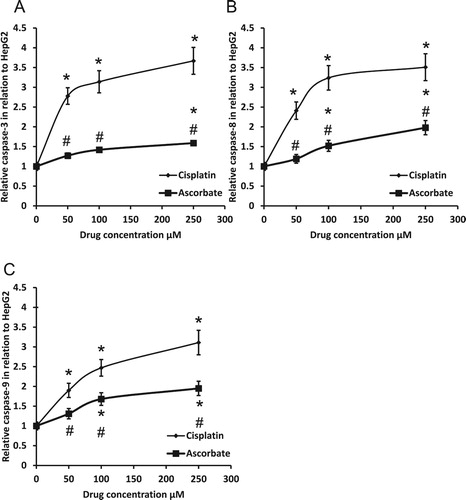
Figure 6. Effect of 100 mg/kg sodium ascorbate on average number of nodules (A) and serum level of α-fetoprotein (B) in vivo. In addition, hepatic sections stained with hematoxylin/eosin in different rat groups (C). Thick black arrow represented ground glass hepatocytes characterized by homogenous pink or vacuolated cytoplasm. Thin black arrows represented apoptotic nuclei. Yellow arrow represented necrotic hepatocytes at the periphery of the nodules. Scale bar 100 µm. *Significant difference when compared with the control group at p < 0.05. #Significant difference when compared with the HCC group at p < .05.
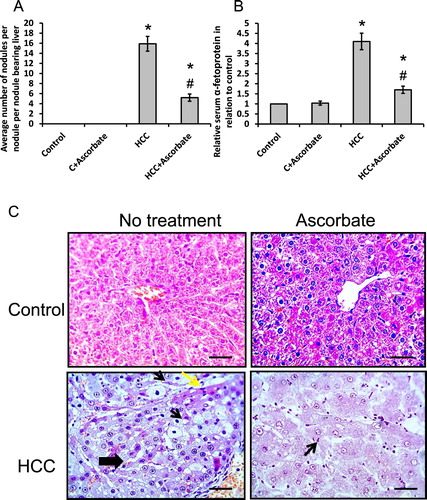
Figure 7. Effect of 50, 100 and 250 μM sodium ascorbate and cisplatin on HepG2 cell survival (A) and HepG2 cell cytotoxicity (B). *Significant difference when compared with HepG2 cells at p < 0.05. #Significant difference when compared with cisplatin-treated HepG2 cells at p < .05.
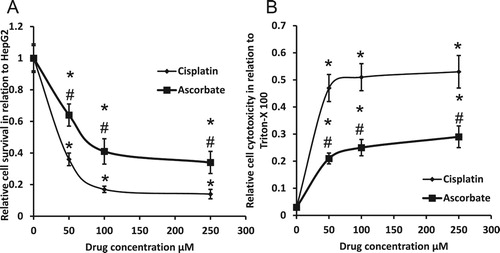
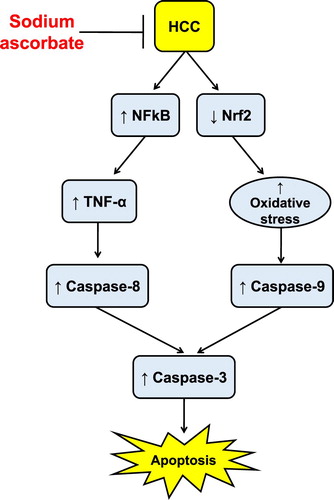
Figure 8. Schematic representation of hepatic protective activity of sodium ascorbate against HCC in vivo.