Figures & data
Figure 1. GW9508 and linoleic acid stimulate ROS production. (A) Production of superoxide by BRIN-BD11 cells incubated in the absence (Control) or presence of different concentrations of GPR40 agonist, GW9508, (20, 100, 150 or 200 μM) in 5.6 or 16.7 mM glucose for 60 min. Results are expressed as mean ± SEM of 3–8 independent experiments. **P<0.01 and ****P<0.0001 versus Control in corresponding glucose concentration. Two-way ANOVA followed by Dunnett. (B) Production of superoxide by BRIN-BD11 incubated in the absence (Control) or presence of different concentrations of linoleic acid (15, 30, 50, 100 or 200 μM) in 5.6 or 16.7 mM glucose for 60 min. Results are expressed as mean ± SEM of 4 independent experiments. ****P<0.0001 versus Control in corresponding glucose concentration. Two-way ANOVA followed by Dunnett. (C) Production of superoxide by BRIN-BD11 cells incubated in the absence (Control) or presence of 20 μM GW9508 in different glucose concentrations (2.8, 5.6, 8.3, 11.1, 16.7 and 20 mM) for 60 min. Results are expressed as mean ± SEM of 7–8 independent experiments. *P<0.05 versus Control in corresponding glucose concentration. Two-way ANOVA followed by Sidak. (D) Production of superoxide by BRIN-BD11 cells incubated in the absence (Control) or presence of 100 μM linoleic acid (Linoleic) in different glucose concentrations (5.6, 8.3, and 16.7 mM) for 60 min. Results are expressed as mean ± SEM of 4 independent experiments. ****P<0.0001 versus Control in corresponding glucose concentration. Two-way ANOVA followed by Sidak. (A–D) Production of superoxide was analyzed by flow cytometry using DHE dye. (E–G) Dynamic production of H2O2 by BRIN-BD11 roGFP2-Orp1 cells. Arrows indicate moment of addition of different conditions. Conditions: Control, 20 μM GPR40 agonist GW9508 (GW9508), 30 μM linoleic acid and 100 μM linoleic acid in different glucose concentrations: 5.6 mM (E), 8.3 mM (F) and 16.7 mM (G). Results are expressed as OxDroGFP2 of 3–6 independent experiments.
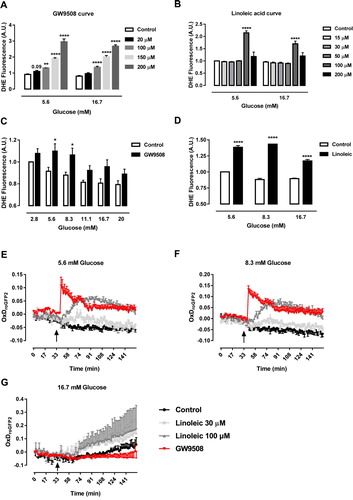
Figure 2. p47phox migration from cytosol to plasma membrane after exposure to GW9508. (A–B) Protein expression of cytosolic and membrane fractions of p47phox in BRIN-BD11 cells after GPR40 stimulation with 20 μM of GW9508 for 0, 5, 10, 20, 30 and 40 min in 5.6 mM glucose. (C) Cytosolic fractions separately. (D) Membrane fractions separately. Results are expressed as mean ± SEM of 4 independent experiments. *P<0.05. One-way ANOVA followed by Tukey. (E–F) Protein expression of cytosolic and membrane fractions of p47phox in BRIN-BD11 cells after GPR40 stimulation with 20 μM of GW9508 for 0, 5, 10, 20, 30 and 40 min in 16.7 mM glucose. (G) Cytosolic fractions separately. (H) Membrane fractions separately. Results are expressed as mean ± SEM of 4 independent experiments.
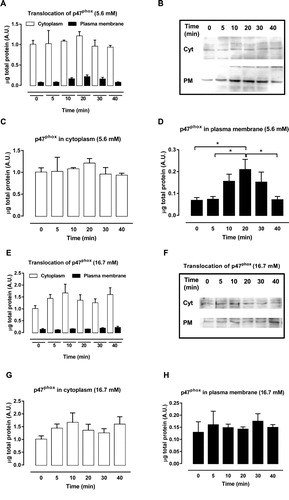
Figure 3. Inhibition of NADPH oxidase reduces superoxide production induced by GW9508 and linoleic acid. (A) Production of superoxide in BRIN-BD11 cells after stimulation of GPR40 with 20 μM GW9508 in the presence or absence of a NADPH oxidase inhibitor, VAS2870, at different glucose concentrations (5.6 and 16.7 mM) for 60 min. Results are expressed as mean ± SEM of 7 independent experiments. *P<0.05, **P<0.01, ***P<0.001 and ****P<0.0001 versus Control or versus GW9508 (in brackets) in corresponding glucose concentration. Two-way ANOVA followed by Tukey. (B) Protein expression of p22phox in BRIN-BD11 cells submitted to small interfering RNA (siRNA) protocol. Conditions: non-transfected cells (Control), cells with lipofectamine alone (Lipo), cells transfected with scrambled siRNA (siRNA Ctrl) and cells transfected with siRNA p22phox (siRNA p22phox). Western blot analysis was performed using anti-p22phox and anti-CD73 (internal control). Results are expressed as mean ± SEM of 4 independent experiments. **P<0.01 versus siRNA Ctrl. One-way ANOVA followed by Sidak. (C) Production of superoxide in BRIN-BD11 cells transfected with scrambled siRNA (siRNA Ctrl) or siRNA p22phox in absence or presence of 20 μM GW9508 in 5.6 or 16.7 mM glucose for 60 min. Results are expressed as mean ± SEM of 13 independent experiments. *P<0.05 and ****P<0.0001 versus siRNA Ctrl or siRNA Ctrl + GW9508 (in brackets) in corresponding glucose concentration. Two-way ANOVA followed by Tukey. (D) Production of superoxide in BRIN-BD11 cells transfected with scrambled siRNA (siRNA Ctrl) or siRNA p22phox in absence or presence of 100 μM linoleic acid (Linoleic) in 5.6 or 16.7 mM glucose for 60 min. Results are expressed as mean ± SEM of 4 independent experiments. *P<0.05, ***P<0.001 and ****P<0.0001 versus siRNA Ctrl or siRNA Ctrl + linoleic (in brackets) in corresponding glucose concentration. Two-way ANOVA followed by Tukey. (A,C,D) Production of superoxide was analyzed by flow cytometry using DHE dye.
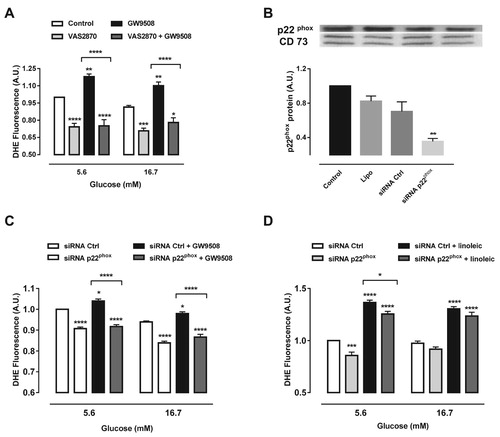
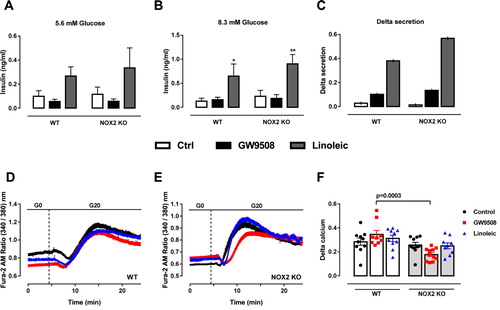
Figure 4. Impact of NADPH oxidase on insulin secretion and calcium dynamics induced by GW9508 and linoleic acid. (A–C) Insulin secretion of islets from C57BL/6J wild type (WT) or NOX2 deficient (NOX2 KO) mice in the absence (Control) or presence of 20 µM GW9508 (GW9508) or 100 μM linoleic acid (Linoleic) for 60 min in 5.6 mM (A) and 8.3 mM (B) of glucose. Results are expressed as mean ± SEM for 3–6 independent experiments. *P<0.05 and **P<0.01 versus Control in corresponding glucose concentration. Two-way ANOVA followed by Tukey. (C) Delta secretion (insulin secretion at 8.3 mM glucose subtracted from insulin secretion in 5.6 mM glucose). (D,E) Dynamic measurements of Ca2+ of islets from C57BL/6J wild type (WT) (D) or NOX2 deficient (NOX2 KO) mice (E). Islets were incubated for 60 min in the absence (Control) or presence of 20 µM GW9508 (GW9508) or 30 μM linoleic acid (Linoleic) and Ca2+ measurements were performed using Fura-2 AM dye under the microscope Axio Observer 7. Islets were first incubated without glucose (G0), followed by addition of 20 mM of glucose (G20). (F) Delta calcium response to glucose. Averaged values on minute 14 were subtracted from averaged values on minute 4. Results are expressed as mean ± SEM for 3 independent experiments. P value versus WT in same condition is shown at the graph. One-way ANOVA followed by Tukey.