Figures & data
Table 1. Participant characteristics.
Figure 1. Concentration of plasma inflammatory biomarkers in participants with type 2 diabetes and healthy control (mean ± SD). N.B. TNF-α – Tumour necrosis factor alpha.
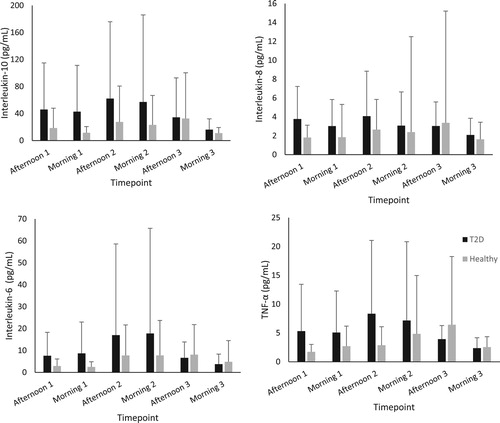
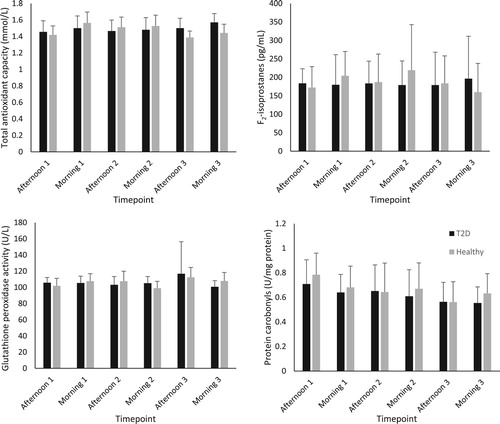
Figure 2. Concentration of plasma oxidative stress biomarkers in participants with type 2 diabetes and healthy control (mean ± SD).