Figures & data
Figure 1. Activation of signal transduction cascades. Densitometric quantification of the results of the PathScan Akt Array (arbitrary units) as indicated. For each experimental group, tissue of n = 4 animals was analyzed.
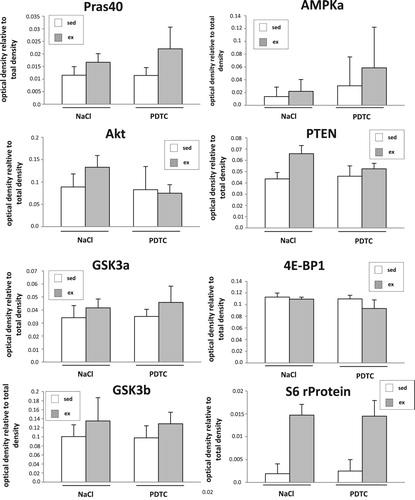
Figure 2. Regulation of genes related to stress and inflammation. Expression of the Il6 (A), Il6r (B), Cxcl5 (C), Egr1 (D), MafF (E), and Ho1 (F) genes was analyzed by qPCR as indicated.
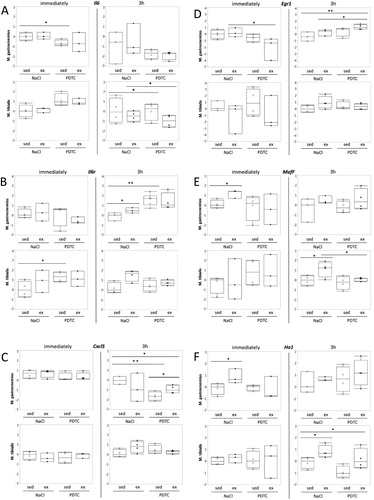
Figure 3. Regulation of genes related to metabolism. Expression of the Ppargc1a (A), Ucp3 (B), Nr4a3 (C), and Cox4 (D), Myoglobin (E), and Glut4 (F) genes was analyzed by qPCR as indicated.
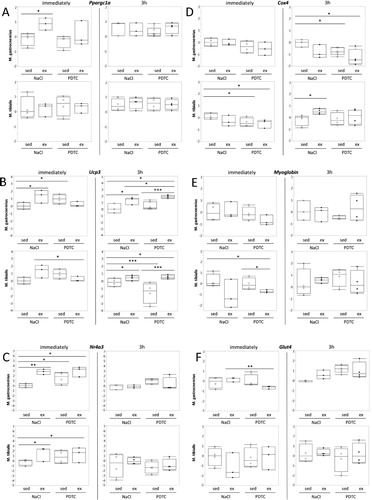
Figure 4. Regulation of genes encoding myosin heavy chain isoforms and actinin 3. Expression of the MyH1 (A), MyH2 (B), MyH4 (C), MyH7 (D), and Actn3 (E) genes was analyzed by qPCR as indicated.
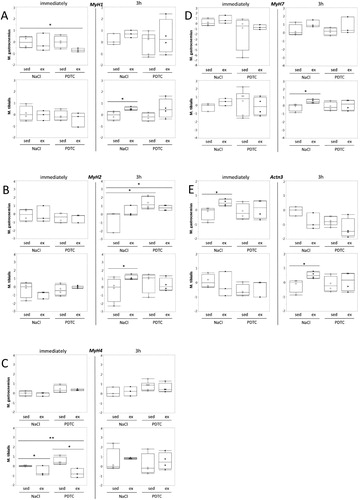
Figure 5. Regulation of genes encoding sarcomere-associated E3 ubiquitin ligases (‘atrogenes’). Expression of the MuRF1 / Trim63 (A) and the Atrogin 1 / FBox32 (B) genes was analyzed by qPCR as indicated.
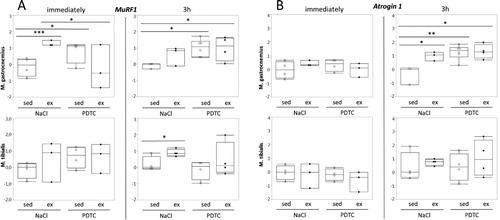
Figure 6. Regulation of genes encoding components of the miR biogenesis pathway. Expression of genes encoding individual components of the miR biogenesis pathway was analyzed by qPCR as indicated.
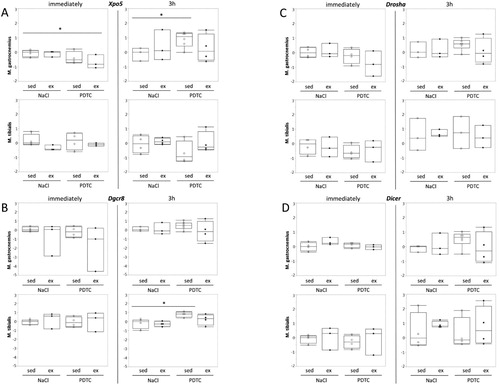
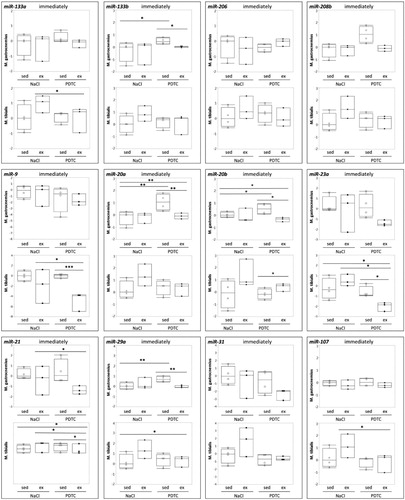
Figure 7. Regulation of selected miRs in response to exercise and PDTC. Concentrations of selected miRs were analyzed by qPCR as indicated.