Figures & data
Figure 1. Female mice are resistant to DIO and deletion of the Grx2 gene is not required for protection from HFD-induced weight gain. (A) Mass of mice fed a CD and HFD (N = 8). (B) Food intake (N = 8). (C) Blood glucose concentration (N = 4–6). (D) Abdominal fat pad mass (N = 4). Mean ± SEM, two-way ANOVA with a Tukey's post-hoc test for A–C and one-way ANOVA with a Tukey's post-hoc test for D. (E) Serum triglyceride levels (N = 4), mean ± SEM, one-way ANOVA with a Tukey's post-hoc test. (F) Liver glycogen granule content (N = 3). (G) Intrahepatic staining of neutral lipids with Oil Red-O (N = 3).
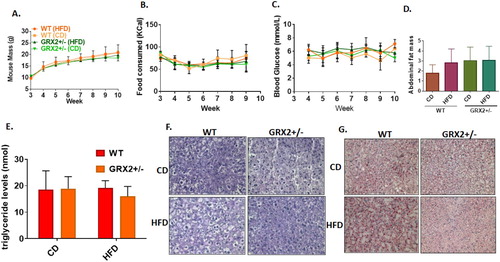
Figure 2. WT and GRX2+/− female mice fed a CD or HFD do not display any changes in glutathione redox buffering capacity or development of oxidative stress. (A) Total serum glutathione levels and the ratio of GSH to GSSG. (B) Mitochondria from muscle and liver tissue were isolated and examined for the presence of 4-hydroxy-2-nonenal/protein adducts. N = 4, mean ± SEM, one-way ANOVA with a Tukey's post-hoc test.
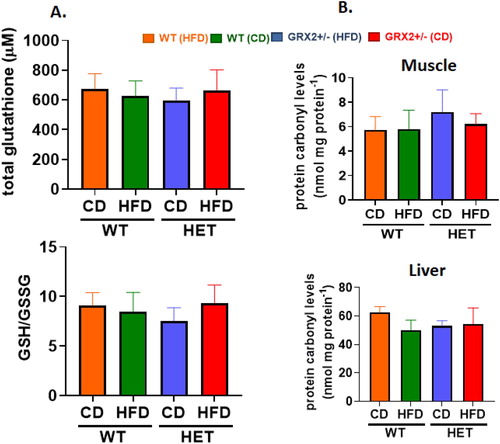
Figure 3. Muscle mitochondria from WT and GRX2+/− female mice fed a CD or HFD do not display any significant changes in bioenergetics. Skeletal muscle mitochondria were isolated and the different states of respiration were measured using an Oxytherm Clark-type electrode. State 2 was initiated by the addition of substrate followed by the induction of state 3 respiration through the treatment of mitochondria with ADP. State 4 respiration was induced once mitochondria had exhausted their ADP supply and were treated with oligomycin. N = 4, mean ± SEM, one-way ANOVA with a Tukey's post-hoc test.
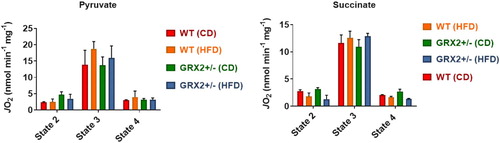
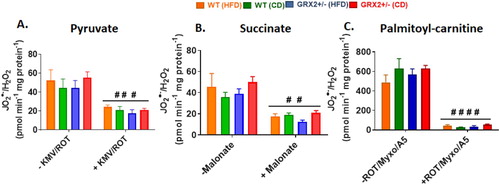
Figure 4. Muscle mitochondria from female mice do not display significant differences in the rate of H2O2 production. Skeletal muscle mitochondria were isolated, energized with pyruvate/malate, succinate, or palmitoyl-carnitine, and then the rate of H2O2 production was measured over the course of 5 min using Amplex UltraRed. Mitochondria were treated with various inhibitors for ROS production to ensure changes in the fluorescent signal were associated with H2O2 generation. N = 4, mean ± SEM, one-way ANOVA with a Tukey's post-hoc test.

Figure 5. Liver mitochondria from GRX2+/− female mice fed a CD or HFD have significantly higher rates of ADP-stimulated respiration. Liver mitochondria were isolated and the different states of respiration were measured using an Oxytherm Clark-type electrode. State 2 was initiated by the addition of substrate followed by the induction of state 3 respiration through the treatment of mitochondria with ADP. State 4 respiration was induced once mitochondria had exhausted their ADP supply and were treated with oligomycin. N = 3–5, mean ± SEM, one-way ANOVA with a Tukey's post-hoc test.
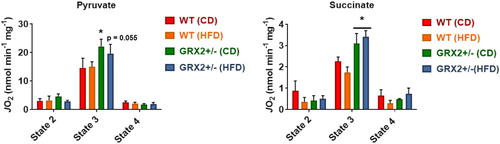
Figure 6. Liver mitochondria from female mice do not display significant differences in the rate of H2O2 production. Mitochondria were isolated, energized with pyruvate/malate, succinate, or palmitoyl-carnitine, and then the rate of H2O2 production was measured over the course of 5 min using Amplex UltraRed. Mitochondria were treated with various inhibitors for ROS production to ensure changes in the fluorescent signal were associated with H2O2 generation. N = 4, mean ± SEM, 1-way ANOVA with a Tukey's post-hoc test.