Figures & data
Table 1. Sequences of primers used in qRT-PCR.
Figure 1. Cytotoxic screening for NF and SFN: A. Human BPH-1 cells were seeded at a density of 1 ×10⁶ cell per milliliter and treated with or without NF (0.625 µM, 1.25 µM, 2.5 µM, 5 µM, 10 µM, 20 µM, and 40 µM) for 24 and 48 h. Cell Counting Kit 8 was used to measure the percentage of cell viability. B. Human BPH-1 cell were seeded at a density of 1 ×10⁶ cells per milliliter and treated with or without SFN (3 µM, 7 µM, 15 µM, 30 µM, and 60 µM) for 24 and 48 h. (n = 5).
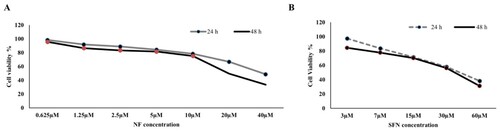
Figure 2. Mechanism of Nrf2 activation by NF: Human BPH-1 cells were treated with NF 3 µM, 9 µM, and SFN 15 µM for 24 and 48 h. A. The gene expression of Nrf2, HO-1, NQO1, Keap1 were normalized with GAPDH B. Protein expression of Nrf2, HO-1, NQO1, Keap1, GAPDH were determined with western blot. C. Relative protein expression of Nrf2, HO-1, NQO1, and Keap1 are normalized with GAPDH. D. Comparison of the Nrf2 and Keap1 relative gene expression at 24 and 48 h and all the values are normalized with GAPDH. E. Comparison of the Nrf2 and Keap1 relative protein expression at 24 and 48 h and all the values are normalized with GAPDH. Values are presented as means ± SD (n = 3). For NF: *P< 0.05, **P< 0.01, ***P< 0.001 compared to control group. For SFN: #P< 0.05, ## P< 0.01, ###P< 0.001 compared to control group (no treatment).
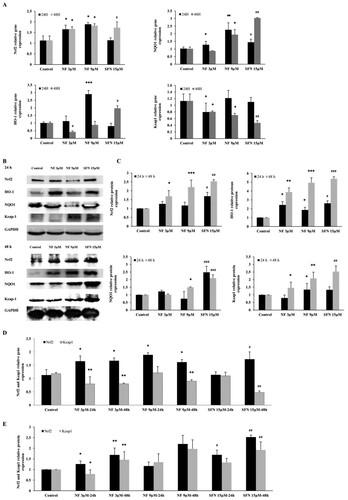
Figure 3. Protective effect of NF against OS: Human BPH-1 cells were treated with NF 3, 9 µM and SFN 15 µM for 48 h. A. ROS was determined with DCFH-DA staining and observed under Laser scanning confocal microscope (x 100) B. DCFH-DA fluorescence intensity representation. C. Determination of SOD, GST and MDA activity at 48 h. Values are presented as means ± SD (n = 5). For NF: *P< 0.05, **P< 0.01 compared to control group. For SFN: #P< 0.05, ## P< 0.01 compared to that of the control group (no treatment).
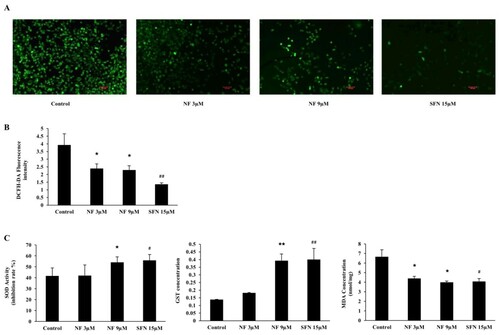
Figure 4. BPH condition amended by reducing cell proliferation: Human BPH-1 cells were treated with NF 3, 9 µM and SFN 15 µM for 48 h. A. After treated for 48 h, alive cells were determined with immunofluorescence analysis using DAPI staining, B. Relative Fluorescence intensity. Values are presented as means ± SD (n = 3). For NF: ***P< 0.001 compared to control group. For SFN: ##P< 0.01 compared to control group (no treatment).
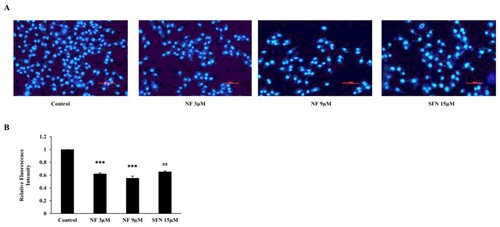
Figure 5. Apoptotic regulation by NF: Human BPH-1 cells were treated with NF 3, 9 µM and SFN 15 µM for 48 h. A. After treatment, apoptosis was determined with flow cytometry analysis using Annexin V-PI staining, B. Protein expression of Bax, Bcl-2, Cyt-c, cleaved caspase 9, cleaved caspase 3 and GAPDH were determined with western blot. C. Relative protein expression of Bax, Bcl-2, Cyt-c, cleaved caspase 9, cleaved caspase 3 were normalized with GAPDH. D. Comparison of the Nrf2, Bax, and Bcl2 relative protein expression at 48 h and all the values are normalized with GAPDH. Values are presented as means ± SD (n = 3). For NF: *P< 0.05, **P< 0.01, ***P< 0.001 compared to control group. For SFN: #P< 0.05, ## P< 0.01 compared to control group (no treatment). a (P< 0.05) compared to the Nrf2 of the control group (no treatment), b (P< 0.01) compared to the Nrf2 of NF 3 µM group, c (P< 0.05) compared to the Nrf2 of NF 9 µM group, and d (P< 0.05) compared to the Nrf2 of SFN 15 µM group.
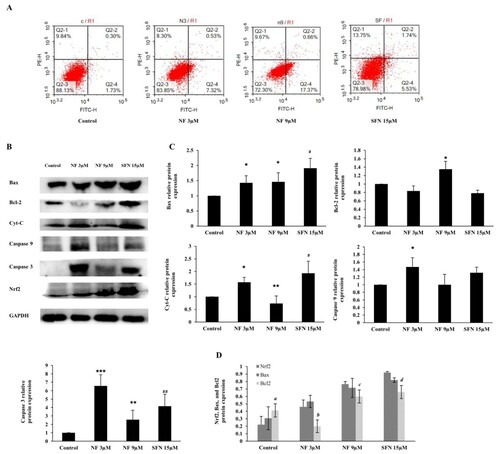
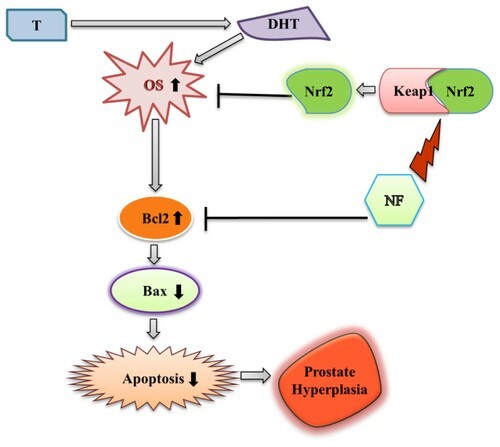
Figure 6. Modulation of BPH by NF: This illustrates the possible mechanism of NF to ameliorate BPH condition through regulation of OS and apoptosis. T = Testosterone, DHT = Dihydrotestosterone, OS = Oxidative stress, and NF = Neferine.