Figures & data
Table 1. Tabular design of experiment.
Figure 1. Effect of CFA and zingerone on LPO and activity of SOD, GPx and catalase. Values are presented as mean ± SD; n = 6 animals in each group. **indicates significance at P < 0.01 from the control group. ***indicates significance at P < 0.001 from the control group. #indicates significance at P < 0.05 from the CFA group. ##indicates significance at P < 0.01 from the CFA group. ###indicates significance at P < 0.001 from the CFA group. na = non-significant. LPO was expressed as nmoles of MDA formed/g tissue, SOD as units/mg protein, Gpx as nmoles of NADPH oxidized/mg protein and catalase as nmoles of H2O2 consumed/min/mg protein.
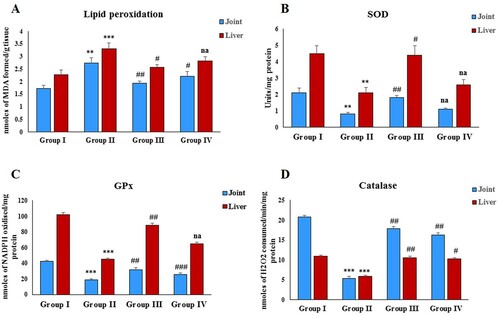
Figure 2. Effect of CFA and zingerone on NF-κB, TNF-α and TGF-β in cell-free extract of joint. Values are presented as mean ± SE; n = 6 animals in each group. **indicates significance at P < 0.01 from the control group. ***indicates significance at P < 0.001 from the control group. ##indicates significance at P < 0.01 from the CFA group. ### indicates significance at P < 0.001 from the CFA group. NF-κB, TNF-α and TGF-β were measured as pg/g protein.
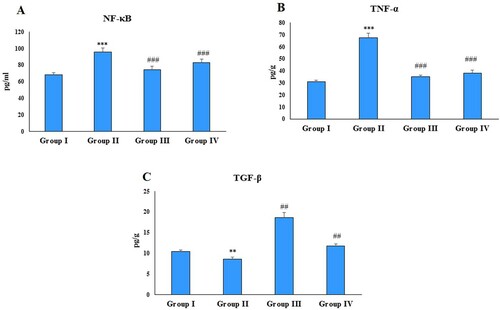
Figure 3. Effect of CFA and zingerone on IL-1β, IL-6, IL-10 and Hs-CRP in cell-free extract of joint. Values are presented as mean ± SE; n = 6 animals in each group. **indicates significance at P < 0.01 from the control group. ##indicates significance at P < 0.01 from the CFA group, na = non-significant. IL-1β, IL-6, IL-10 and Hs-CRP were measured as pg/g protein.
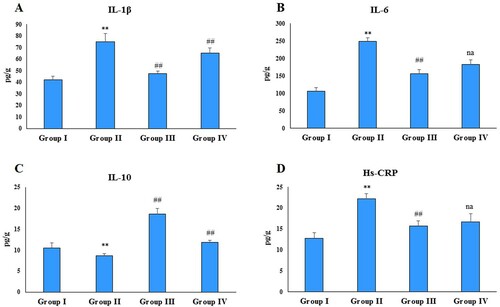
Figure 4. Effect of CFA and zingerone on NF-κB, TNF-α, and TGF-β levels in serum. Values are presented as mean ± SE; n = 6 animals in each group. *indicates significance at P < 0.05 from the control group. ***indicates significance at P < 0.001 from the control group. #indicates significance at P < 0.05 from the CFA group. ##indicates significance at P < 0.01 from the CFA group. ### indicates significance at P < 0.001 from the CFA group. na = non-significant. NF-κB, TNF-α and TGF-β were measured as pg/ml.
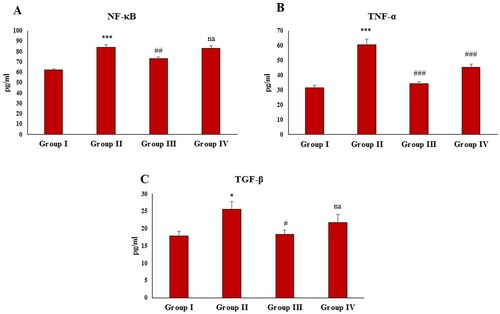
Figure 5. Effect of CFA and zingerone on IL-β, IL-6, IL-10 and Hs-CRP levels in serum. Values are presented as mean ± SE; n = 6 animals in each group. **indicates significance at P < 0.01 from the control group. ***indicates significance at P < 0.001 from the control group. ##indicates significance at P < 0.01 the CFA group. ### indicates significance at P < 0.001 from the CFA group. na = non-significant. IL-1β, IL-6, IL-10 and Hs-CRP were measured as pg/g protein.
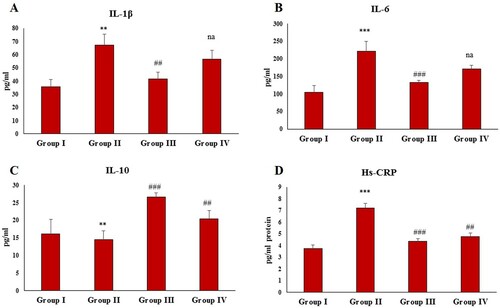
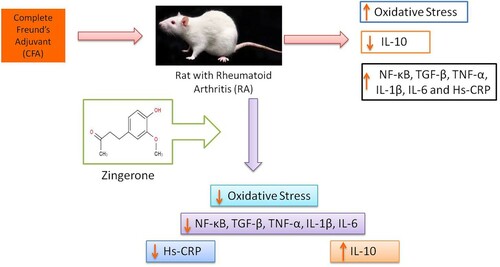
Figure 6. Different mechanism of action of zingerone in arthritis.