
Figures & data
Table 1. Demographics and baseline characteristics of the study cohort.
Figure 1. Cyst fluid R2 values and total iron levels among the four groups. This figure shows the distribution of R2 values (A) and total iron levels (B) for each studied group. a vs. b, P < 0.001 by the Kruskal-Wallis test followed by Bonferroni's correction.
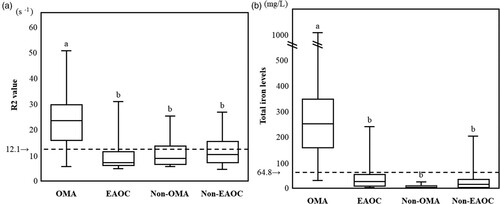
Table 2. CF total iron levels and R2 value for each group.
Figure 2. Correlation between cyst fluid total iron concentrations and R2 values. Patients in the area surrounded by the dotted line showed higher R2 values than expected from total iron levels.
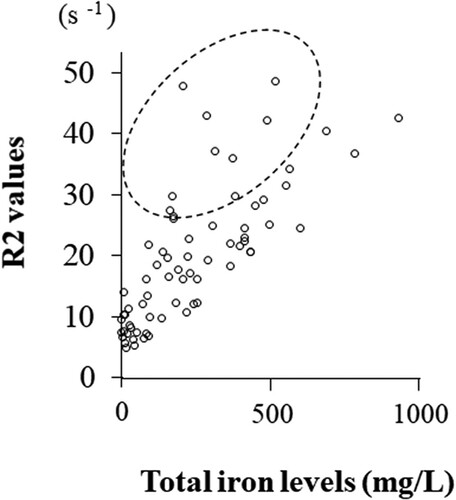
Table 3. Correlation of all types of iron-related compounds with oxidative marker (8-OHdG) and all antioxidant markers (bilirubin, HO-1, and TAC) in the cyst.
Table 4. Correlation of R2 values with iron-related compounds and antioxidants in the cysts.
Figure 3. Concentration of bio-elements (cations) in the contents of ovarian cysts. a vs. b, P < 0.05; b vs. c, P < 0.001; and a vs. c; P < 0.001 by the Kruskal-Wallis test followed by Bonferroni's correction.
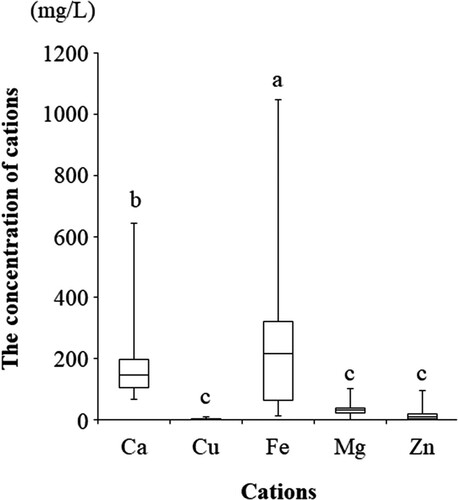
Table 5. Correlation of R2 values with bio-elements (cations) in the cysts.
Data availability statement
The datasets used and/or analyzed during the current study are available from the corresponding author on reasonable request.