
Figures & data
Figure 1. Different pretreatment and sampling methods of saliva. (A) Scenic description of seven pretreatment methods: untreated, centrifugation, saturated ZnSO4, NaOH plus ZnSO4 and centrifugation, filtration, centrifugation plus MeOH, and NaOH plus centrifugation. (B) ratio of NO2− (ti) to NO2− (t0) versus time with methods described in (A). t0 was when the first measurement was performed immediately after pre-treatment. ti was when nitrite was measured at time length i: 2, 6, 12 or 24 h. (C) nitrite concentrations within 24 h with one of these two sampling methods: spitting (spit), cotton swabbing (cotton swab), followed by pretreatment of NaOH plus centrifugation.
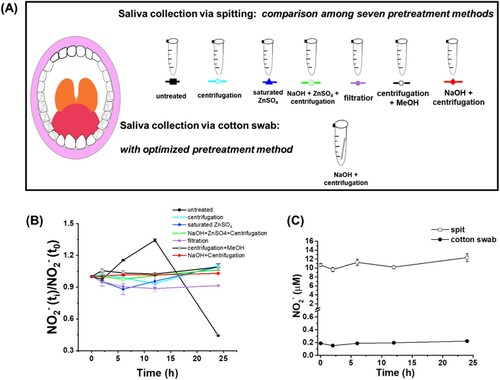
Table 1. Summary of concentrations of salivary nitrite.
Figure 2. Concentrations of salivary nitrite, serum nitrite and nitrate in the ASD and Control groups. (A) salivary nitrite in the ASD and Control groups (p < 0.0001); (B) serum nitrite in the ASD and Control groups (p < 0.0001); (C) serum nitrate in the ASD and Control groups (p = 0.0109); (D) salivary nitrite of male and female participants in each group; (E) serum nitrite of male and female participants in each group; (F) serum nitrate of male and female participants in each group.
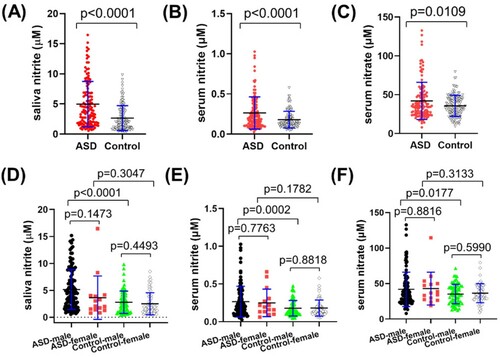
Table 2. Summary of concentrations of nitrite and nitrate in blood among children.
Figure 3. Correlation among saliva nitrite, serum nitrite and serum nitrate in the ASD group (A–C), in the male participants of the ASD group (D–F), and in the female participants of the ASD group (G–I).
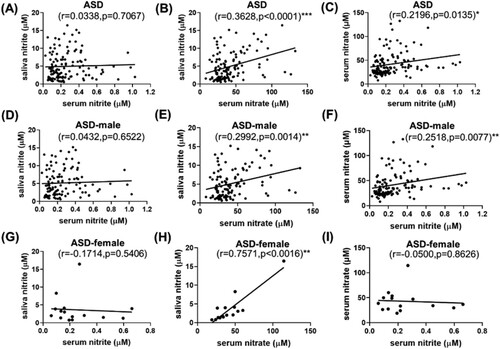
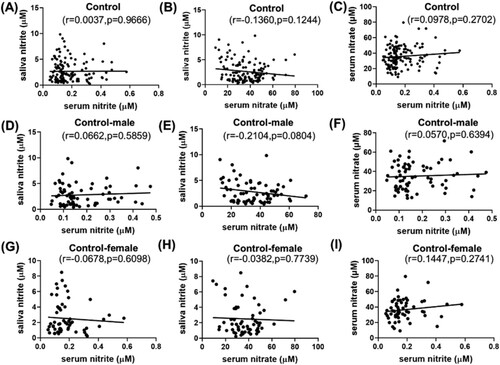
Figure 4. Correlation among saliva nitrite, serum nitrite and serum nitrate in the Control group (A–C), in the male participants of the Control group (D–F), and in the female participants of the Control group (G–I).
Supplemental Material
Download MS Word (239.2 KB)Data availability statement
Due to the nature of this research, participants of this study did not agree for their personal data to be shared publicly, and they agreed to share the measured biochemical data online. All the biochemical data used in this study have been deposited to the https://data.mendeley.com/ database (DOI:10.17632/8kz7rwmwnt.1).