Figures & data
Figure 1. Arterial structure shown by H&E staining (A, B, C) and the extent of fibrosis determined by Masson’s trichrome staining (E, F, G) and α-SMA- AF488 immunofluorescence staining (I, J, K). (D) shows the location where the mouse aorta was cut to obtain aortic rings (white arrow). Digital analysis of the wall thickness was compared in (H). Digital analysis of the ratio of non-fibrotic areas mainly including smooth muscle (red) and fibrotic areas mainly including collagen (blue) was presented in (L). Original magnification was ×10 in figure A–C and E–G and was ×63 in figure I–K. Data were as means ± SD (n = 8–9 each). *p < 0.05, **p < 0.01.
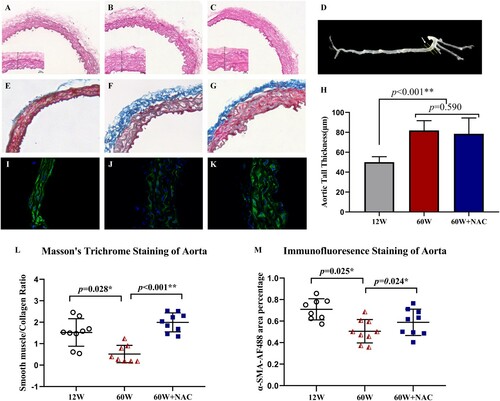
Figure 2. Representative dihydroethidium staining (A–C) and quantitative analysis of the red signal (J) in aortas from different age groups and after NAC treatment. The aortic ring in blank field was shown in figure D-F. Original magnification was ×10 in figure A–F and was ×63 in figure G–I. Data were as means ± SD (n = 8 each). *p < 0.05, **p < 0.01.
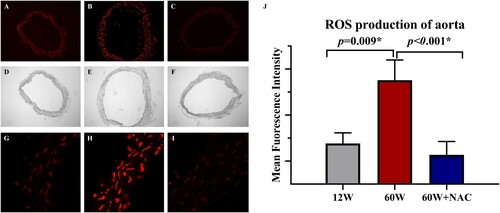
Figure 3. Digested cells of the whole aortic tissue were analyzed by flow cytometry. Gates set up were based on FMO controls (A). Live cells, CD45 positive leukocytes, CD45 and CD107 double positive macrophages were obtained. M1 and M2 populations were identified by staining anti-CD80 BV786, and anti-CD206 PE antibodies further (A). (B) shows the comparison results of the total number of macrophages between different groups. The total percentages of CD45+/CD107+macrophages were significantly higher in aging groups (p < 0.01). The ratio of M1 (CD45+/CD107+/CD80+/CD206-) to M2 (CD45+/CD107+/CD80-/CD206+) macrophages (C) was significantly higher in the 60 W group than in the 12 W group (p = 0.038), and the 12-week NAC treatment reversed this phenomenon (p = 0.002). A positive relationship (D) between the M1/M2 macrophage ratio and collagen areas percentage stained by Masson’s trichrome in the aortic walls was observed (r = 0.528, p = 0.003). Data were as means ± SD (n = 12 each). *p < 0.05, **p < 0.01.
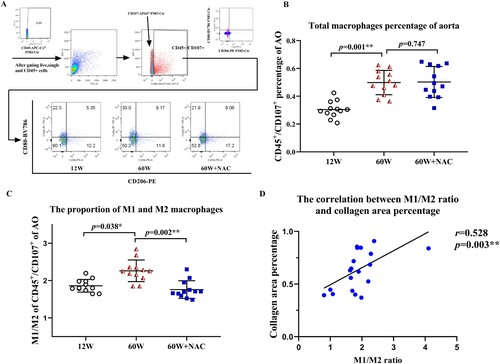
Figure 4. (A) M2 macrophages in the aortic sinus sections were identified by anti-F4/80 AF594 and anti-CD206 AF647 antibodies. F4/80-AF594(red) represented the total macrophages and CD206-AF647(green) represented M2 macrophages. (B) Bar charts show quantification results for the ratio of M2/total macrophages (CD206-AF647+ cells/ F4/80-AF594+cells), M2 (F4/80+/CD206+). The ratio in the aorta sinus was lower in 60W group compared to 12W group (p = 0.05), 12-week NAC treatment significantly increased this ratio in the aorta sinus (p = 0.008) of the 60 W group. Data were as means ± SD (n = 8 each). *p < 0.05, **p < 0.01.
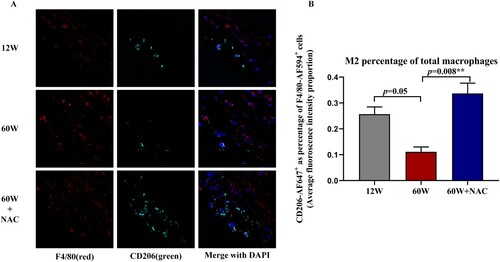
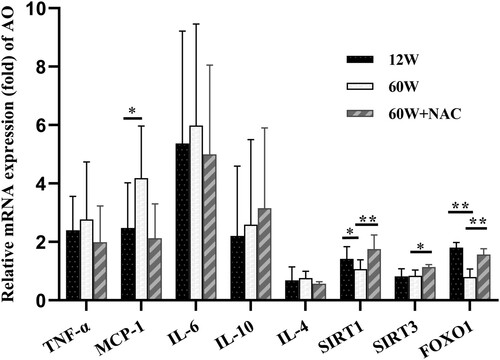
Figure 5. Genetic expression in aorta were detected by qRT-PCR. The aging group had a significantly higher MCP-1 mRNA level and lower SIRT1 and FOXO1 mRNA levels. The 12- week NAC treatment increased the genetic expressions of SIRT1, SIRT3, and FOXO1. Data were as means ± SD (n = 8 each). *p < 0.05, **p < 0.01.