Figures & data
Figure 1. Effects of different concentrations of alfalfa saponins on the viability of IPEC-J2 cells. Dead cells were used as control. In all panels, statistically significant difference between treatments were represented with asterisks (*p < 0.05; **p < 0.01).
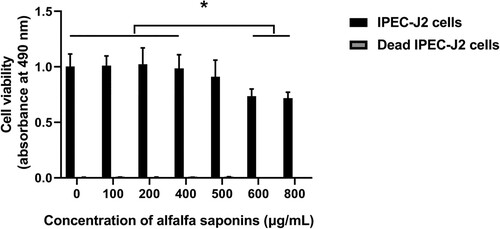
Figure 2. Effects of different concentrations and treatment times of H2O2 on the viability of IPEC-J2 cells: (A) effects of different concentrations of H2O2 on the viability of IPEC-J2 cells and (B) time-dependent effects of H2O2 on cell viability of IPEC-J2 cells. In all panels, statistically significant differences between treatments were represented with asterisks (*p < 0.05; **p < 0.01).
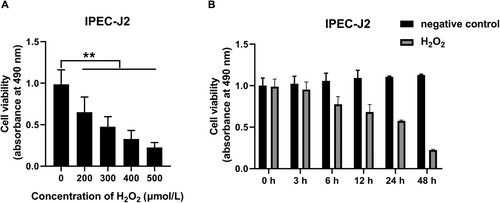
Figure 3. Effects of alfalfa saponins against H2O2-induced oxidative stress damage on IPEC-J2 cells’ viability. In all panels, statistically significant difference between treatments were represented with asterisks (*p < 0.05; **p < 0.01).
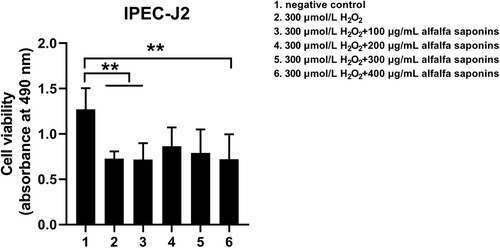
Figure 4. Effects of alfalfa saponins on the antioxidant system in IPEC-J2 cells. (A) Effects of alfalfa saponins on the antioxidant enzyme activity of IPEC-J2 cells induced by H2O2. When the SOD inhibition ratio reaches 50%, the corresponding enzyme amount is one SOD activity unit (U). (B) Effects of alfalfa saponins on the amount of MDA induced by H2O2 in IPEC-J2 cells. (C) Effects of alfalfa saponins against H2O2-induced LDH activity in IPEC-J2 cells. In all panels, statistically significant difference between treatments were represented with asterisks (*p < 0.05; **p < 0.01).
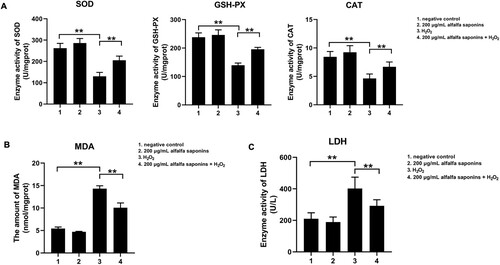
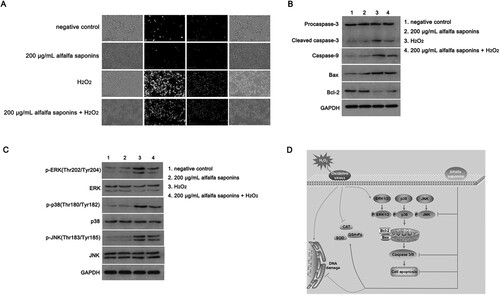
Figure 5. Cell apoptosis analysis of IPEC-J2 cells. (A) Annexin V/PI staining was used to detect cell apoptosis ratio. The green fluorescence of Annexin V-FITC represented by early apoptotic cells. The red fluorescence of PI staining indicated necrotic cells and apoptotic cells in the middle and late stages. The yellow color indicated that Annexin V-FITC and PI could stain the cells. (B) The expression level of apoptosis-related proteins was detected by western blot. (C) Effects of alfalfa saponins on MAPK pathway in IPEC-J2 cells. (D) Protective mechanism of alfalfa saponins in oxidative stress cells.