Figures & data
Table 1. Effect of β-glucan and celastrol on different parameters in the studied groups.
Table 2. Effect of β-glucan and celastrol on mitochondrial reactive oxygen species in the studied groups.
Table 3. Correlation between different studied parameters among the different studied groups.
Figure 1. Graphical presentation of real-time quantitative PCR analysis of the expression of PGC-1α gene in studied groups by fold change. Means within column carrying different superscript letters are significantly different at p ≤ 0.05; a, significance vs. Group I; b, significance vs. Group II; c, significance vs. Group III; d, significance vs. Group IV.
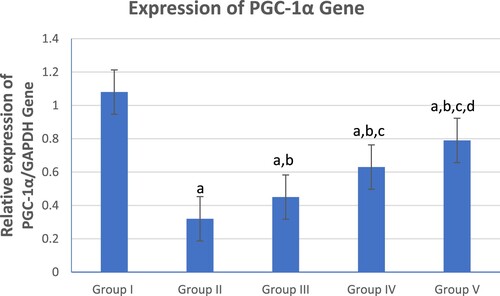
Figure 2. Graphical presentation of real-time quantitative PCR analysis of the expression of FFAR-2 gene in studied groups by fold change. Means within column carrying different superscript letters are significantly different at p ≤ 0.05; a, significance vs. Group I; b, significance vs. Group II; c, significance vs. Group III; d, significance vs. Group IV.
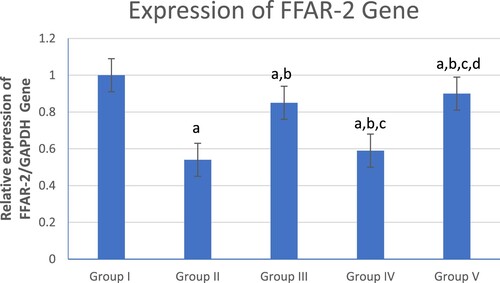
Figure 3. (a) Ulcerative colitis Geboes score 2B.2 showed a marked increase in the neutrophils in the lamina propria (blue arrow, H&E ×100), (b) the same case showed score 3 Bcl-2 expressions (ABC ×100), (c) also showed score 2 expressions of Bax (ABC ×200).
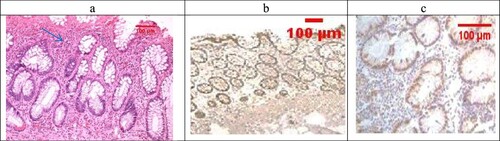
Figure 4. (a) A case of UC Geboes score 4.4 showed marked epithelial injury, cryptitis (blue arrow) and ulcerations (red arrow) (H&E ×100), (b) the same case showed score 4 Bcl2 expressions (ABC ×100), (c) also showed score 4 expressions of Bax (ABC ×100).
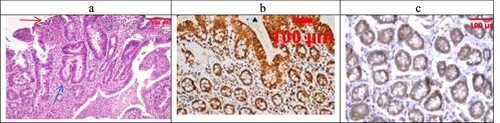
Figure 5. (a) Normal control colon specimen (H&E ×100), (b) normal colon stained by Bcl2 score as 1 (ABC ×100), (c): normal colon stained by Bax scored 1 (ABC ×100).
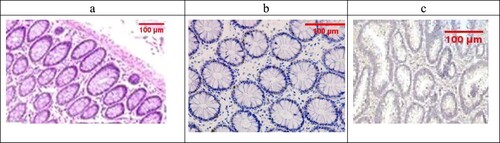
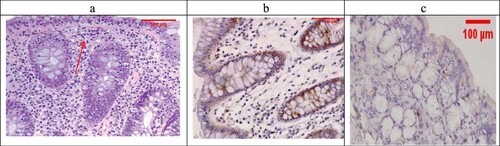
Figure 6. (a) The β-Glucan-treated group showing Geboes score 3.1 in the form of cryptitis (red arrow) and neutrophils seen in some of the epithelium (H&E ×100). (b) The same case showed a score 4 Bcl2 expression (ABC ×200), (c) also showed score a 3 core expression of Bax (ABC ×200).
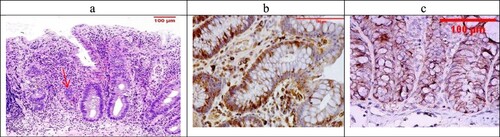
Figure 7. (a) The Celastrol-treated group showing Geboes score 3.2 in the form of cryptitis and neutrophils (red arrow) seen in most of the epithelium (H&E ×100). (b) The same case showed score a 2 Bcl2 expression (ABC ×200), (c) also showed a score 3 expression of Bax (ABC ×100).
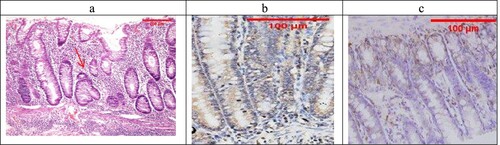
Figure 8. The combined-treated group showing Geboes score 1.2 in the form of a marked increase in the basal plasma cells only (red arrow) (H&E ×200). (b) The same case showed a score 2 Bcl2 expression (ABC ×200), (c) also showed a score 1 expression of Bax (ABC ×100).