
Figures & data
Table 1. Demographic and clinical data of the studied groups.
Table 2. Biochemical parameters of the studied groups.
Figure 1. Photomicrographs representation of DNA damage in peripheral blood mononuclear cells using comet assay in control group (A), diabetic group without retinopathy (B), nonproliferative diabetic retinopathy group (C), proliferative diabetic retinopathy group (D). (The scale bar is 40 µm, 5 fields were assessed to provide this representative image).
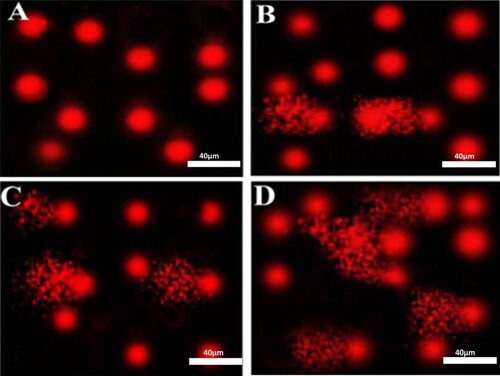
Table 3. Comet assay parameters obtained by image analysis in peripheral blood mononuclear cells of the studied groups.
Figure 2. HIF1A–AS2 relative expression in the studied groups. Data are represented as mean ± SD. * Significant difference vs. control group (P < 0.05). # Significant difference vs. diabetic group without retinopathy (P < 0.05). ▴Significant difference vs. nonproliferative diabetic retinopathy group (P < 0.05). ◊ Significant difference vs. proliferative diabetic retinopathy group (P < 0.05).
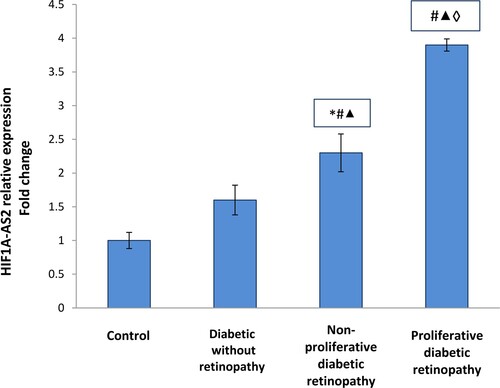
Table 4. Correlations between the studied parameters in diabetic retinopathy patients.
Table 5. Multiple linear regression analysis for potential predictors of proliferative diabetic retinopathy.
Supplemental Material
Download MS Word (81.3 KB)Data availability statement
Research data are not publically shared.