
Figures & data
Table 1. The primers set used for detection of gene expression in rats.
Figure 1. Effect of ulcerative colitis (UC) and 15 mg/kg sulforaphane on colon length (a) and weight (b). *Significant difference as compared with control group at p < .05. #Significant difference as compared with UC group at p < .05.
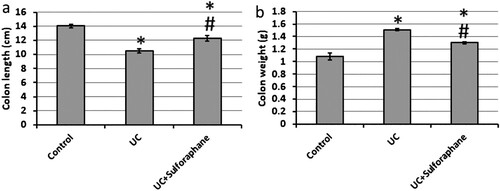
Figure 2. Colon sections stained with Masson trichrome in control group (a), ulcerative colitis (UC, b) and UC treated with 15 mg/kg sulforaphane (c). Examination of UC group revealed damaged intestinal glands (yellow arrows), severe hemorrhage (red arrows) and extensive fibrosis (black arrows). The fibrotic area was calculated for each group (d). The micro-images represented the results of examining three rats in each group with examination of 10 fields in each rat. *Significant difference as compared with control group at p < .05. #Significant difference as compared with UC group at p < .05.
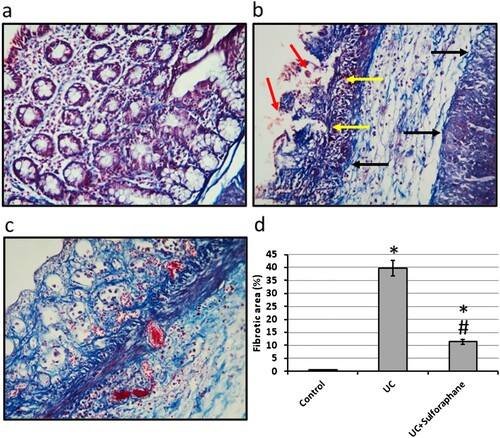
Figure 3. Electromicrographs (transmission electron microscopy) of colon samples from the control group (a), ulcerative colitis (UC, b) and UC treated with 15 mg/kg sulforaphane (c). Images represented Goblet cell nucleus (G), mucus granules (m), typical microvilli (black arrows heads), enterocytes nucleus in a basal position (N), lysosomes (L) and intercellular space (between white arrow heads). Scale bar is 5 µm. The micro-images represented the results of examining three rats in each group with examination of 10 fields in each rat.
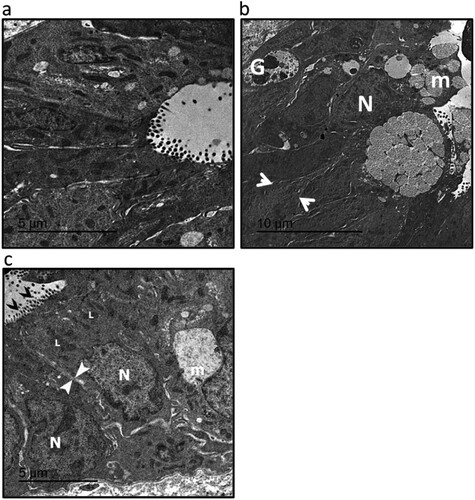
Figure 4. Effect of ulcerative colitis (UC) and 15 mg/kg sulforaphane on gene expression of proliferator-activated receptor-gamma coactivator (PGC-1, a) and mitochondrial transcription factor A (TFAM, c) as well colon levels of PGC-1 (b) and TFAM (d). *Significant difference as compared with control group at p < .05. #Significant difference as compared with UC group at p < .05.
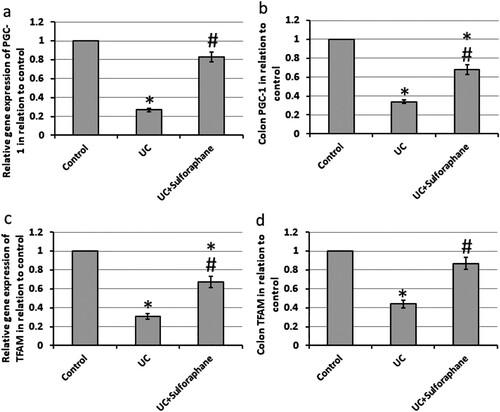
Figure 5. Effect of ulcerative colitis (UC) and 15 mg/kg sulforaphane on gene expression of nuclear factor erythroid 2-related factor 2 (Nrf2, a) and Heme Oxygenase-1 (HO-1, c) as well colon levels of Nrf2 (b) and HO-1 (d). *Significant difference as compared with control group at p < .05.
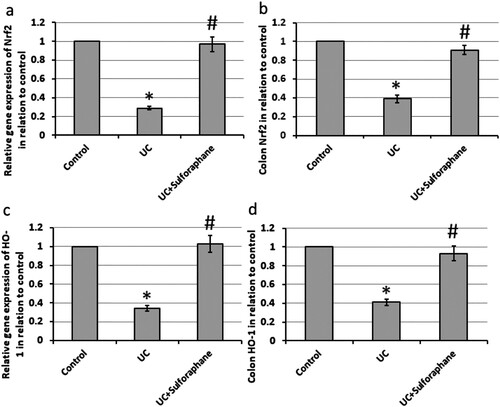
Figure 6. Effect of ulcerative colitis (UC) and 15 mg/kg sulforaphane on colon levels of nitric oxide (NO, a), malondialdehyde (MDA, b), reduced glutathione (c) and glutathione peroxidase (GPx). #Significant difference as compared with UC group at p < .05.
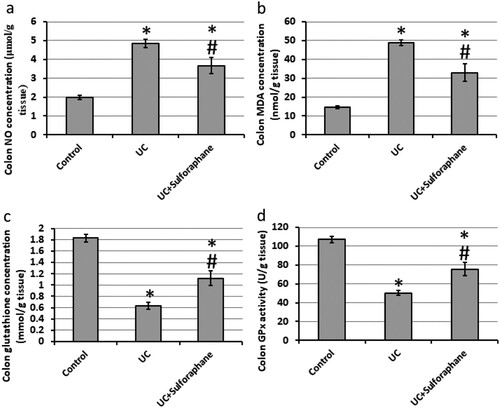
Figure 7. Effect of ulcerative colitis (UC) and 15 mg/kg sulforaphane on gene expression of mammalian target of rapamycin (mTOR, a) and cyclin D1 (c) as well colon levels of mTOR (b) and cyclin D1 (d). *Significant difference as compared with control group at p < .05. #Significant difference as compared with UC group at p < .05.
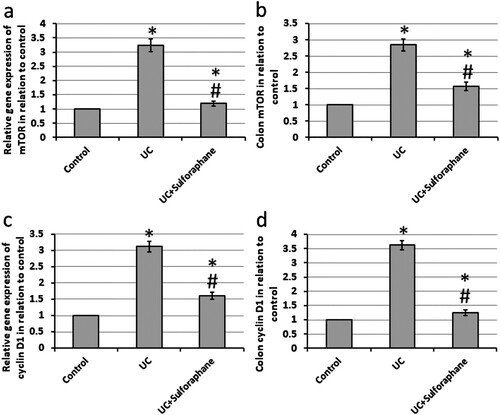
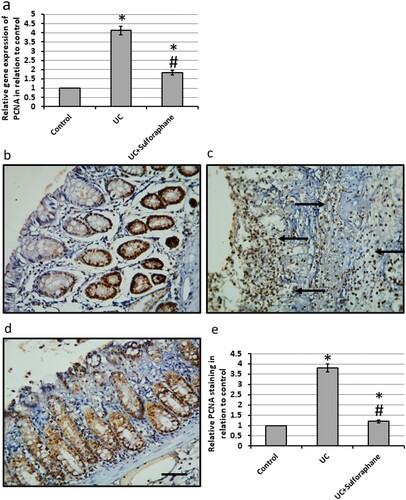
Figure 8. Effect of ulcerative colitis (UC) and 15 mg/kg sulforaphane on gene expression of proliferating cell nuclear antigen (PCNA, a) as well colon sections stained with anti-PCNA antibodies in control group (b), UC group (c) and UC group treated with sulforaphane (d). Immunohistochemistry score of positive staining (e). *Significant difference as compared with control group at p < .05. #Significant difference as compared with UC group at p < .05. The micro-images represented the results of examining three rats in each group with examination of 10 fields in each rat.
Data availability statement
The datasets used and/or analyzed during the current study are available from the corresponding author on reasonable request.