
Figures & data
Figure 1. De novo transcription of hras mRNA in reactive astrocytes is redox-sensitive. Relative mRNA expression levels by qPCR of hras and kras (A), iNOS and c-myc (B) genes in primary neocortical astrocytes challenged with 500 μM H2O2 for 30, 60 or 120 min in complete medium and in the presence or in the absence of Act D (10 μg/ml) pre-treatment. (C) qPCR analysis of astrocytic hras, kras, iNOS, c-myc treated with Act D alone as control (10 μg/ml; for 30, 60, 120 min). The mRNA levels are normalized to 18S RNA levels and the graph is plotted relative to untreated/growing value. Statistical analysis derived from four experiments in duplicate (n ≥ 8; mean ± SD); *P < 0.01 (matched pairs t-test) compared to untreated sample. See Supplementary Figure S1–S7 for statistical analysis raw data.
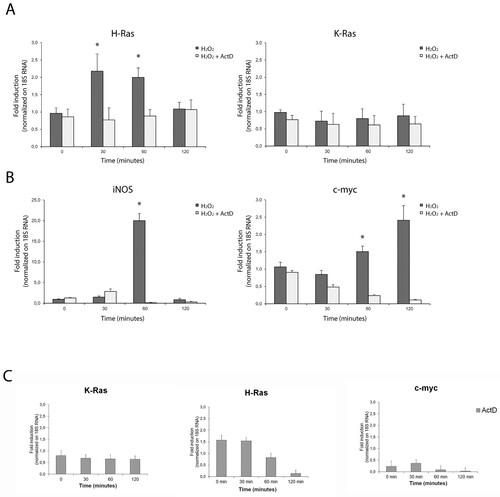
Figure 2. Quantitative transcriptional analysis by qPCR of proto-oncogenes hras, kras, iNOS, c-myc in primary neocortical astrocytes subjected to serum withdrawal (time = 3 h) and/or serum addition (time = 1 h). The mRNA levels are normalized to 18S RNA levels. Statistical analysis derived from four experiments in duplicate (n ≥ 8; mean ± SD); *P < 0.01 (matched pairs t-test) compared to untreated/growing value. See Supplementary Figure S1–S7 for statistical analysis raw data.
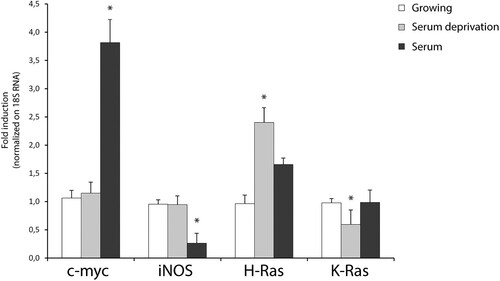
Table 1. Complete list of murine DNA oligonucleotides used for qPCR.
Figure 3. Redox-stimulation decreased protein turnover of H-Ras. (A) Representative immunoblot analysis of Ras in response to serum withdrawal or hydrogen peroxide administration. Acutely stimulated murine astrocytes were lysed with RIPA and immunoblot analysis with commercial antibodies against total Ras, ERK 1/2 and phosphorylated (p-) ERK ½ is shown. Growing primary astrocytes (15 DIV in 10% FCS serum) were subjected to trophic deprivation (0% FCS serum) or hydrogen peroxide administration (H2O2 500 μM in complete serum) in presence or not of cycloheximide (CHX) pre-treatment for the indicated times. β-actin bands served as a loading control. Densitometric analysis is reported below (See Supplementary Figure S9 Raw data from densitometric analysis of western blot relative to panel A) (B) Astrocytes deprived of serum (i) or hydrogen peroxide treated (ii) were subjected to immunoblot analysis with the indicated antibodies anti-H-Ras Millipore #MAB3291; anti-K-Ras Sigma R3400; anti-GFAP #MAB3402 Clone GA5. Tubulin bands served as a loading control. Densitometric analyses of the Western blotting experiments results are reported as histogram above each panel and performed using Image Studio Light version 5. (See Supplementary Figure S10 and S14 Raw data from densitometric analysis of western blot relative to ) **P < 0.0001; *P < 0.01; °P < 0.05 as compared with the untreated astrocytes (Student’s t-test).
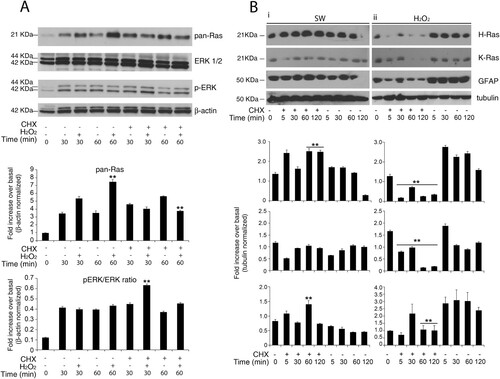
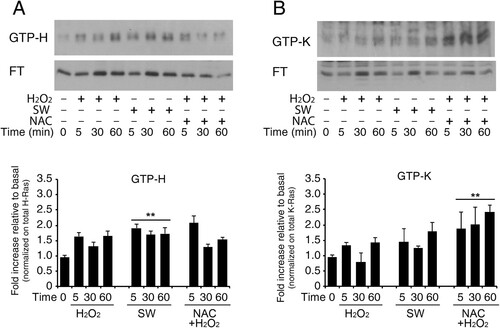
Figure 4. Increase in GTP-bound H-Ras in reactive astrocytes by redox stimulation. Acutely stimulated murine astrocytes were subjected to commercial c-Raf-1 RBD pull-down assay. Cells were grown and stimulated as indicated after or not pre-loading with the ROS scavenger N-Acetyl cysteine in complete serum (labels: SW, serum withdrawal; H2O2, hydrogen peroxide addition; NAC, N-Acetyl cysteine). H-Ras and K-Ras GTP-bound fractions were quantified by immunoblot after GST-RBD pull-down assay as described in Methods. Panel A shows immunoblot analysis of GTP-bound H-Ras and its flow-through (F.T.). The immunoblot is probed with the specific antibody anti-H-Ras (#MAB3291). Panel B shows immunoblot analysis of GTP-bound K-Ras and its flow-through (F.T.); the immunoblot is probed with the specific anti-K-Ras (Proteintech #12063-1-AP). Results represent the average of two independent experiments. Histogram representation of the quantitative densitometric analysis of GTP-bound fraction of each isoform and values are total Ras relative variation (see Supplementary Figure S14, Dataset ) **P < 0.0001; *P < 0.001; °P < 0.05 as compared with the untreated astrocytes (Student’s t-test).
Supplemental Material
Download PDF (9.5 MB)Data availability statement
The original contributions presented in the study are included in the Supplementary Materials. Further inquiries can be directed to the corresponding author.