
Figures & data
Figure 1. Time schedule of drug treatments.
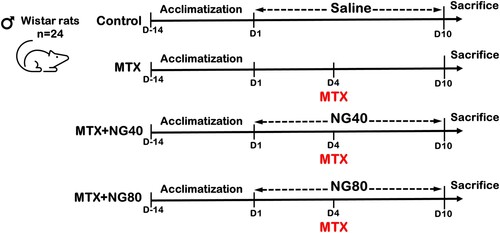
Figure 2. Effect of MTX and/or NG on antioxidant defense system. Each value represents the mean ± SE. Bar chart with different letters indicate significant difference at p < 0.05 (One-Way ANOVA).
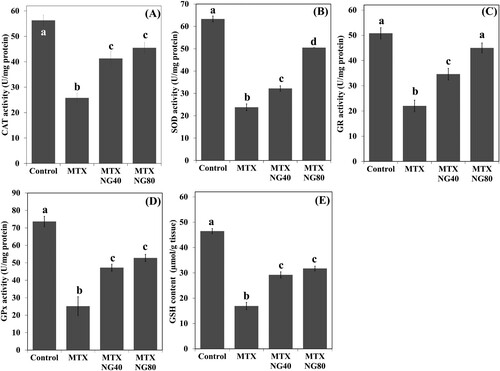
Figure 3. Effect of MTX and/or NG on testis MDA and NO levels, and serum testosterone. Each value represents the mean ± SE. Bar chart with different letters indicate significant difference at p < 0.05 (One-Way ANOVA).
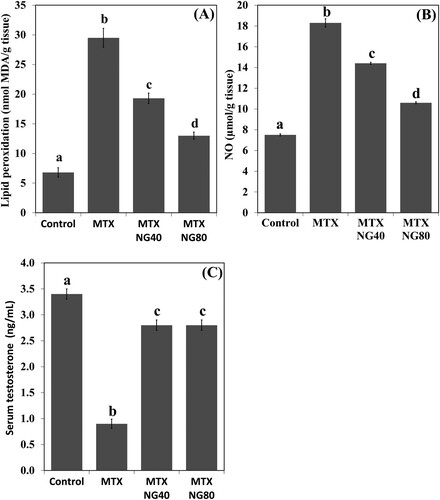
Figure 4. Electron micrographs of testicular tissue from the control group. (A) Normal appearance of spermatogonia type A (Sg-A) and B (Sg-B), primary spermatocytes (PS) and Sertoli cell (Sc). (B) Higher magnification of (A) showing Sertoli-Sertoli junctional complexes (arrows). (C) Round spermatids (Sd) at the phase of acrosomal formation. Arrow: acrosomal cap, G: Golgi apparatus. (D) Leydig cell (Lc) with nucleus (N) depicting fine granular chromatin and clear nuclear membranes, mitochondria (M), smooth endoplasmic reticula (sER) and lipid droplets (L). Scale bar: 10 µm (A), 5 µm (B, C), 2 µm (D).
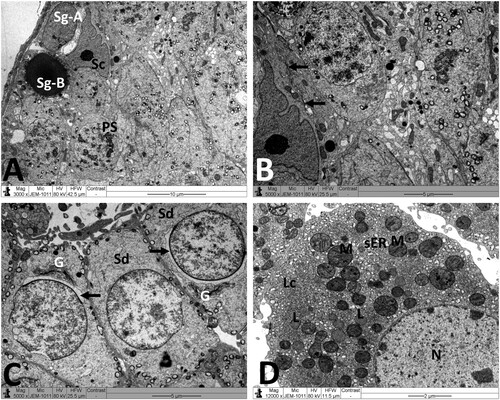
Figure 5. Electron micrographs of testicular tissue from the MTX group. (A) Part of Sertoli cell (Sc) with extensive cytoplasmic loss and vacuolation (V). Note also: deformed primary spermatocyte (PS) displaying perinuclear space (arrow). (B) Sertoli cell (Sc) showing a large number of primary and secondary lysosomes (Ly). (C) Early stage spermatid (Sd) appears with marked irregularities of the nucleus (N) and acrosomal cap (arrow). SP: primary spermatocyte. (D) Deleterious changes in Leydig cell (Lc) are discernible. The nucleus (N) shows contended peripheral chromatin and distended envelope. In the cytoplasm, observe the presence of many lipid vacuoles (L), sparse smooth endoplasmic reticula, and disintegrated mitochondria (M) with broken cristae. Scale bar: 5 µm (A–C), 2 µm (D).
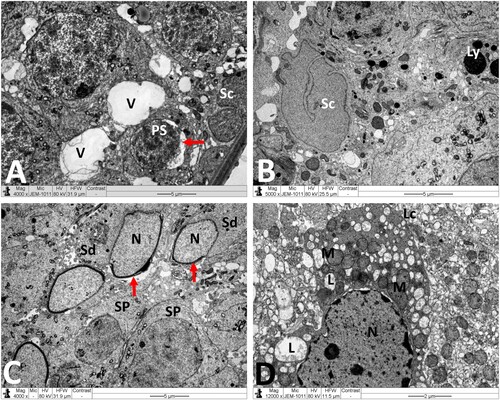
Figure 6. Electron micrographs of testicular tissue from the MTX + NG40 group. (A) Sertoli cell (Sc), lysosomes (arrow) in Sertoli cell cytoplasm, spermatogonium type B (Sg-B), vacuoles (V) between spermatogonia and Sertoli cell, and primary spermatocytes (PS) in normal ultrastructure. (B) Marked detachment (*) of Sertoli cell (Sc) from basal lamina (BM), vacuoles separation areas (V) between spermatogonia type B (Sg-B) and Sertoli cell (Sc), M: mitochondria, L: lipid inclusions, Ly: lysosomes, spermatozoon (Sz) in normal ultrastructure, and degenerated spermatozoa with loss of acrosome (arrow) and nuclear fragmentation (arrowhead). (C) Normal ultrastructure features of early spermatids (Sd) at different developmental stages. Arrow points to abnormal dislocation of acrosomal vesicle inside spermatid nucleus. (D) Leydig cell nucleus (N) with less condensed chromatin, and normal mitochondria (M), minimal lipid inclusions (L) and prominent smooth endoplasmic reticula (sER) in Leydig cell cytoplasm. Scale bar: 10 µm (A), 5 µm (B, C), 2 µm (D).
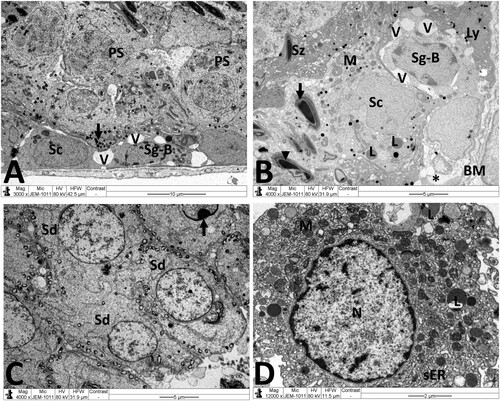
Figure 7. Electron micrographs of testicular tissue from the MTX + NG80 group. (A) Spermatogonia type B (Sg-B) and Sertoli cell (Sc) are located on basal lamina (MB), spermatocytes (SP), early spermatids (Sd) and spermatozoa (Sz) are noticed similar to the control group, and fragments of damaged spermatozoa (arrows) can also be seen. (B) Sertoli cells (Sc) with small empty spaces and vacuoles (V), and well-preserved contact between Sertoli cells and primary spermatocytes (PS). (C) Normal morphology of early spermatids (Sd). Observe malformed spermatid with vacuolated acrosomal region (red circle). (D) Normal Leydig cell nucleus (N), mitochondria (M), and smooth endoplasmic reticula (sER). Scale bar: 10 µm (A), 5 µm (B, C), 2 µm (D).
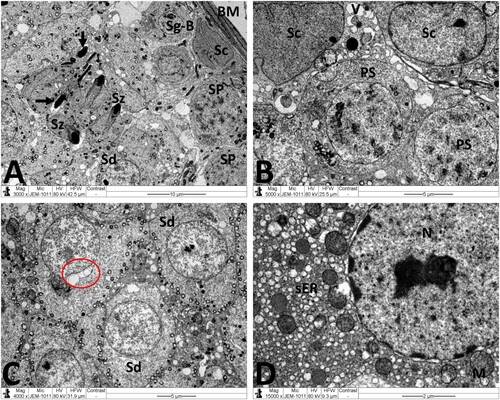
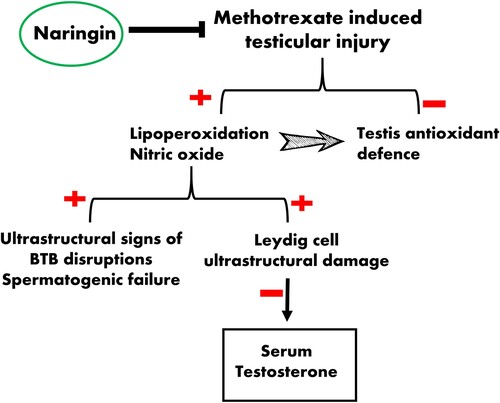
Figure 8. Schematic diagram illustrating the protective potential of NG during MTX-induced testicular oxidative stress.
Data availability statement
The authors declare that data supporting the findings of this study are available within the article.