
Figures & data
Figure 1. ISG15 and HERC5 levels were increased and β-catenin levels were decreased in the liver tissue of the EtOH-Fed Mice. (A) Establishment of an alcoholic fatty liver model. Hematoxylin and eosin (H&E) staining and Oil Red staining of alcoholic fatty liver mice liver sections (50×, 200×), Data represent the mean ± SD for 6–8 mice. (B-C) The expression levels of SREBP-1 and PPAR-α were detected by qRT-PCR and western blotting. (D-F) The mRNA expression levels of ISG15, HERC5, and β-Catenin were detected by qRT-PCR. (G) Results of the triglyceride (TG) levels of the hepatic tissue. (H-J) The protein expression levels of ISG15, HERC5, and β-catenin were detected by qRT-PCR and western blotting. *p < 0.05, **p < 0.01 versus control group. Data represent the mean ± SD for 3–4 independent experiments.
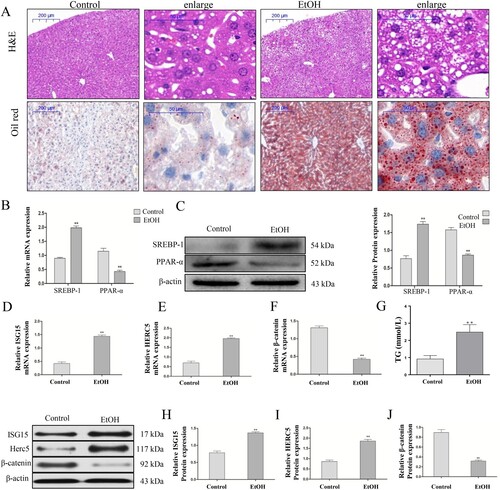
Figure 2. The model of EtOH-stimulated AML-12 cells wherein ISG15, and HERC5 had high expression levels and β-catenin had low expression levels. (A-B) The expression levels of ISG15 and HERC5 were detected by qRT-PCR. (C-E) The expression levels of ISG15 and HERC5 were detected by western blotting. (F-G) The expression levels of β-Catenin were detected by qRT-PCR and western blotting. (H) The expression levels of SREBP-1 and PPAR-α were detected by qRT-PCR. (I) The expression levels of SREBP-1, PPAR-α were detected by western blotting. (J) The expression of TG levels in cell supernatants. *p < 0.05, **p < 0.01 versus control group. Data represent the mean ± SD for 3–4 independent experiments.
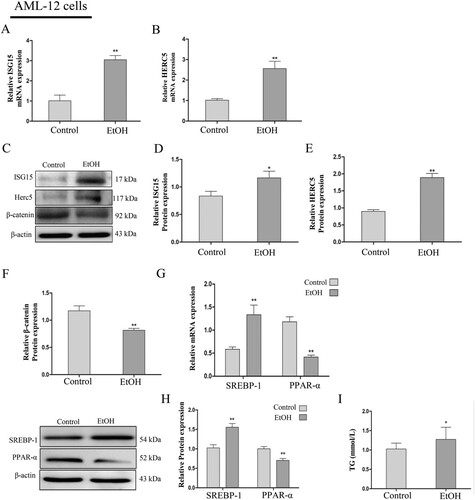
Figure 3. ISG15 and HERC5 levels were increased and β-catenin levels were decreased in EtOH-stimulated L02 cells. (A-B) The expression levels of ISG15 and HERC5 were detected by qRT-PCR. (C-E) The expression levels of ISG15 and HERC5 were detected by western blotting. (F-G) The expression levels of β-Catenin were detected by qRT-PCR and western blotting. (H) The expression levels of SREBP-1 and PPAR-α were detected by qRT-PCR. (I) The expression levels of SREBP-1 and PPAR-α were detected by western blotting. (J) The expression of TG levels in cell supernatants. *p < 0.05, **p < 0.01 versus control group. Data represent the mean ± SD for 3–4 independent experiments.
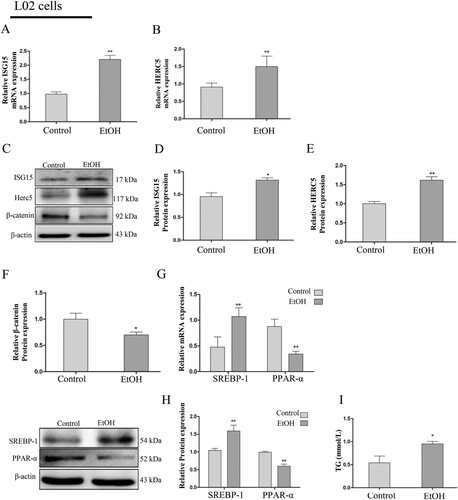
Figure 4. β-catenin tended to bind and stabilize the ISG15 B, C, and G sequences.
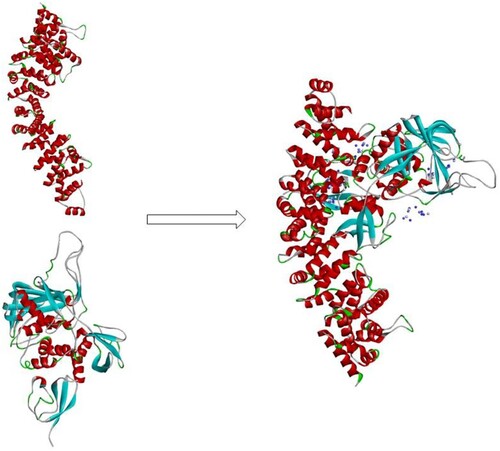
Figure 5. HERC5-siRNA downregulated the levels of β-catenin in EtOH-stimulated L02 cells. (A) Result of the qRT-PCR analysis of HERC5 mRNA expression. (B-C) Results of western blotting analysis of HERC5 and β-Catenin. (D-E) HERC5-siRNA alleviated lipid metabolism disorders in EtOH-stimulated L02 cells. Results of the qRT-PCR and western blotting analysis of SREBP-1and PPAR-α. (F) The expression of TG levels in cell supernatants. (G) The apoptosis protein expression of FOXO3a, BIM, Cleaved-Caspase-3, Bax and Bcl-2 were analyzed by western blotting. (H) The levels of apoptosis were analyzed by flow cytometry. *p < 0.05, **p < 0.01 versus control group. #p < 0.05 or ##p < 0.01 versus NC group. Data represent the mean ± SD for 3–4 independent experiments.
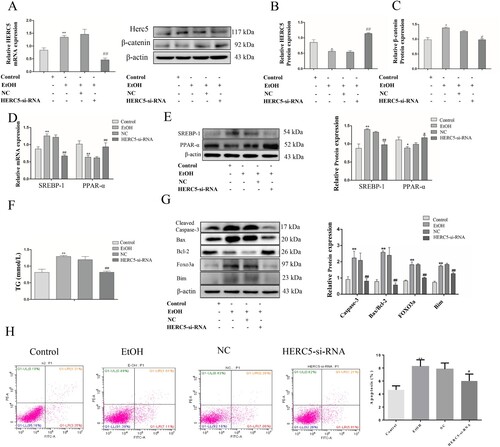
Figure 6. Overexpressed HERC5 upregulated the levels of β-catenin ISGylation in EtOH-stimulated L02 cells. (A) Results of the qRT-PCR analysis of HERC5 mRNA expression. (B-C) Results of the western blotting analyses of HERC5 and β-Catenin. (D-E) Overexpressed HERC5 aggravated lipid metabolism disorders in EtOH-stimulated L02 cells. Results of the qRT-PCR and western blotting analyses of SREBP-1 and PPAR-α. (F) The expression of TG levels in cell supernatants. (G) The apoptosis protein expression of FOXO3a, BIM, Cleaved-Caspase-3, Bax and Bcl-2 were analyzed by western blotting. (H) The levels of apoptosis were analyzed by flow cytometry. *p < 0.05, **p < 0.01 versus control group. #p < 0.05 or ##p < 0.01 versus Vector group. Data represent the mean ± SD for 3–4 independent experiments.
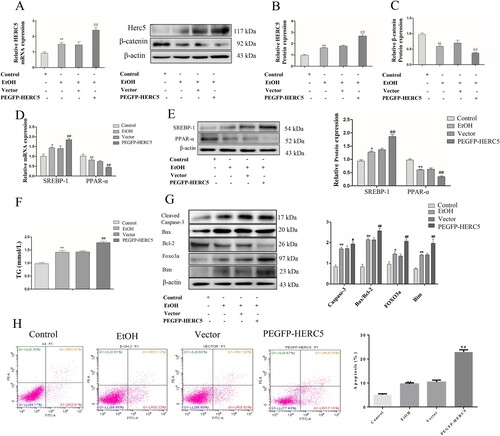
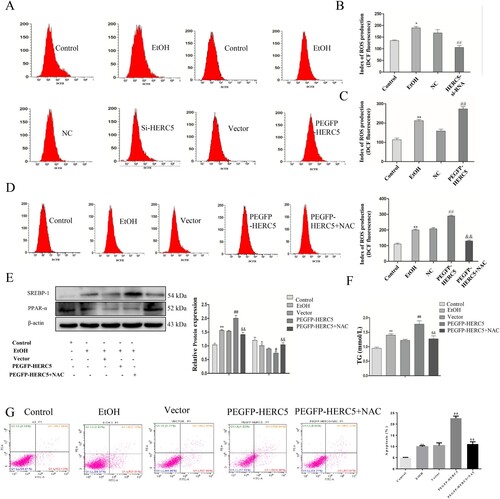
Figure 7. The ISGylation of β-catenin can regulate cell lipid metabolism by altering ROS levels. (A-C) Results of ROS levels in L-02 cells with HERC5-siRNA and pEGFP-HERC5 transfection. (D) Results of the ROS levels in L-02 cells with addition of NAC. (E) Results of the western blotting analysis of SREBP-1 and PPAR-α. (F) Results of the TG analysis. β-catenin ISGylation affects cell apoptosis by regulating ROS levels. (G) The levels of apoptosis were detected by flow cytometry. *p < 0.05, **p < 0.01 versus control group. #p < 0.05, ##p < 0.01 versus NC/Vector group. &p < 0.05, &&p < 0.01 versus pEGFP-HERC5. Data represent the mean ± SD for 3–4 independent experiments.
Data availability statement
The authors confirm that the datasets used and analyzed during the current study are available from the corresponding author on reasonable request.