
Figures & data
Table 1. The primers of cellular protective genes.
Figure 1. Influence of PCs on the morphology and proliferation of HaCaT cells. (a) Morphology of HaCaT cells; (b) Effect of PCs on the morphology of HaCaT cells; (c) Effect of PCs on the proliferation of HaCaT cells. A: 0 μg/mL; B: 30 μg/mL; C: 60 μg/mL; D: 90 μg/mL; E: 120 μg/mL; F: 150 μg/mL.
Note: Compared with the control group, *P < 0.05, **P < 0.01.
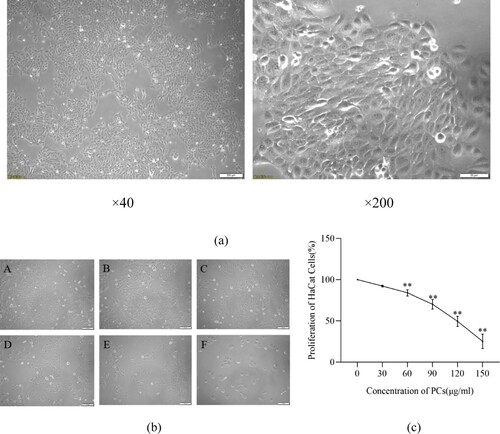
Figure 2. Features of TNF-ɑ-induced psoriasis-like cell model. (a) Morphology of HaCaT cells under the intervention of TNF-α; A: normal group, B: model group; (b) Effect of TNF-α on the proliferation of HaCaT cells; (c) Effect of TNF-α on inflammatory factors in the supernatant of psoriasis-like cells.
Note: Compared with the normal group, **P < 0.01.
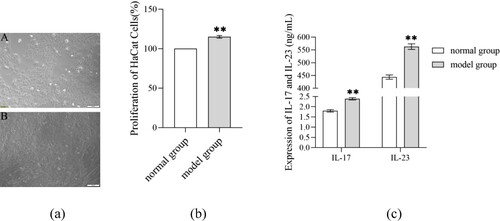
Table 2. Levels of OS-related indicators in supernatant of psoriasis-like cell model (X ± S).
Figure 3. Effect of PCs on psoriasis-like cell models. (a) Effect of TNF-α and PCs on the morphology of HaCaT cells; (b) Effect of TNF-α and PCs on the proliferation of HaCaT cells. A: normal group, B: model group, C: low-concentration PCs group, D: medium-concentration PCs group, E: high-concentration PCs group.
Note: Compared with the normal group, **P < 0.01; Compared with the model group, ##P < 0.01.
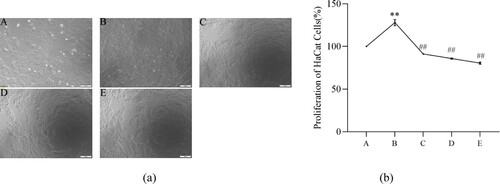
Figure 4. Levels of oxidative indicators in supernatant of different-concentration groups.
Note: Compared with the normal group, *P < 0.05, **P < 0.01; Compared with the model group, ##P < 0.01.
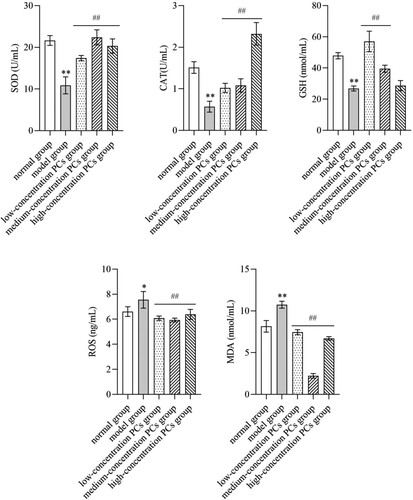
Figure 5. Levels of inflammatory factors in supernatant of different-concentration groups.
Note: Compared with the normal group, **P < 0.01; Compared with the model group, ##P < 0.01.
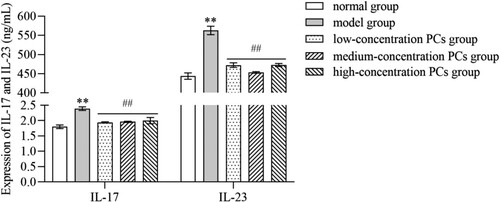
Figure 6. Expression of mRNA/protein different-concentration groups. (a) The mRNA relative expression of OS/inflammatory indicators in different groups; (b) The protein expression of OS/inflammatory indicators in different groups. A: normal group, B: model group, C: low-concentration PCs group, D: medium-concentration PCs group, E: high-concentration PCs group.
Note: Compared with the normal group, **P < 0.01; Compared with the model group, #P < 0.05, ##P < 0.01.
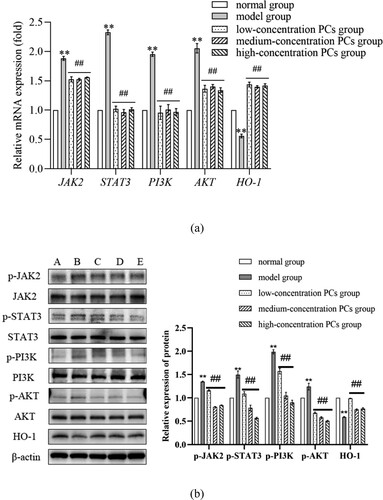
Figure 7. Effect of inhibitor of PI3K on cell proliferative activity and inflammatory factors expression in psoriasis-like cells treated with PCs. (a) Effect of PCs or/and LY294002 on the proliferation of cells; (b) Effect of PCs or/and LY294002 on the levels of inflammatory factors in different groups; (c) The protein band expression of p-PI3K and p-AKT in different groups; (d) The relatively quantitative expression of p-PI3K and p-AKT proteins in different groups.
Note: Compared with the TNF-α+ PCs group, **P < 0.01.
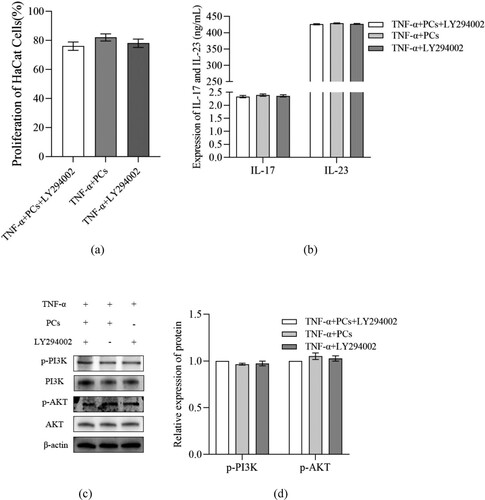
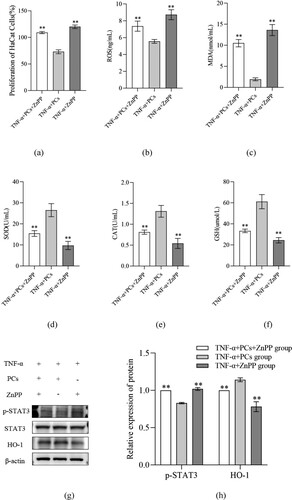
Figure 8. Effect of inhibitor of HO-1 on cell proliferative activity and OS factors expression in psoriasis-like cells treated with PCs. (a) Effect of PCs or/and ZnPP on the proliferation of cells; (b) Level of ROS in supernatant of different groups; (c) Level of MDA in supernatant of different groups; (d) Level of SOD in supernatant of different groups; (e) Level of CAT in supernatant of different groups; (f) Level of GSH in supernatant of different groups; (g) The protein band expression of HO-1 and p-STAT3 in different groups; (h) The relatively quantitative expression of HO-1 and p-STAT3 proteins in different groups.
Note: Compared with the TNF-α+ PCs group, **P < 0.01.
Data availability statement
The data that support the findings of this study are available from the corresponding author upon reasonable request.