
Figures & data
Figure 1. Photomicrographs of the ovarian tissues. Photomicrographs are representatives of 5 replicates per group. The sham-operated rats showed preserved ovarian histoarchitecture. There were oocytes (O) surrounded by cumulus oophorus (CO) that were lined by granulosa cells (GC) and theca cells (THC). The corpus luteum appeared normal. The rats in the ischaemia group (I) showed moderately distorted ovarian histoarchitecture. There were some degenerated follicles (DF) and some developing ooctes (red arrow). The granulosa cell (GC) and theca cells (THC) appeared normal. The rats in the ischaemia/reperfusion group (IR) showed grossly distorted ovarian histoarchitecture. There were degenerated follicles (DF) with distorted granulosa cell (GC) and theca cells (THC) that appeared infiltrated by inflammatory cells. The instertitium appeared congested (red circle). The animals in the ischaemia + atorvastatin group (I + AT) showed mildly distorted ovarian histoarchitecture. There were some degenerated follicles (DF) and some developing follicles (red arrow). The granulosa cell (GC) and theca cells (THC) appeared normal. Also, the corpus luteum (CL) appeared normal. The animals in the ischaemia/reperfusion + atorvastatin group (IR + AT) showed moderately distorted ovarian histoarchitecture. There were degenerated follicles (DF) with normal granulosa cell (GC) and theca cells (THC). The corpus luteum (CL) appeared normal.
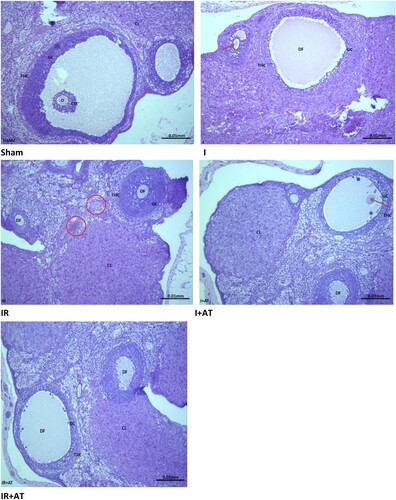
Table 1. Effect of atorvastatin on ovarian histoarchitecture in ovarian I/R animal model.
Table 2. Effect of atorvastatin on ovarian folliculogenesis in ovarian I/R animal model.
Figure 2. Effect of atorvastatin on markers of oxidative stress in ovarian I/R animal model. Data are presented as mean ± SD of 8 replicates per group. I: Ischaemia, I/R: Ischaemia/reperfusion, AT: Atorvastatin. a p < 0.05 versus sham, bp < 0.05 versus I, cp < 0.05 versus IR, dp < 0.05 versus I+ AT using one-way analysis of variance (ANOVA) followed by Tukey's post hoc test for pairwise comparison.
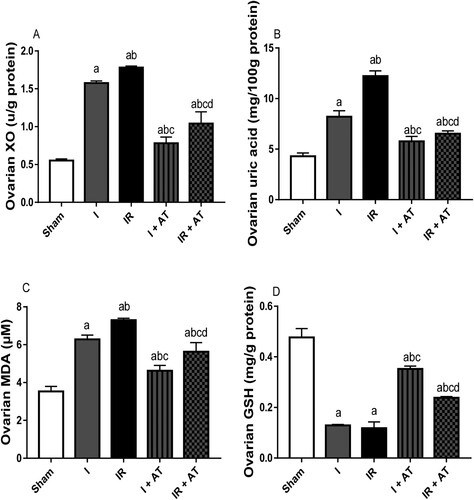
Figure 3. Effect of atorvastatin on the activities of enzymatic antioxidant in ovarian I/R animal model. Data are presented as mean ± SD of 8 replicates per group. I: Ischaemia, I/R: Ischaemia/reperfusion, AT: Atorvastatin. a p < 0.05 versus sham, bp < 0.05 versus I, cp < 0.05 versus IR, dp < 0.05 versus I+ AT using one-way analysis of variance (ANOVA) followed by Tukey's post hoc test for pairwise comparison.
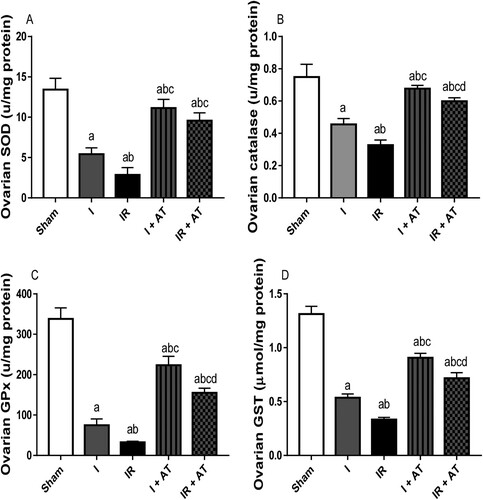
Figure 4. Effect of atorvastatin on inflammatory markers in ovarian I/R animal model. Data are presented as mean ± SD of 8 replicates per group. I: Ischaemia, I/R: Ischaemia/reperfusion, AT: Atorvastatin. a p < 0.05 versus sham, bp < 0.05 versus I, cp < 0.05 versus IR, dp < 0.05 versus I+ AT using one-way analysis of variance (ANOVA) followed by Tukey's post hoc test for pairwise comparison.
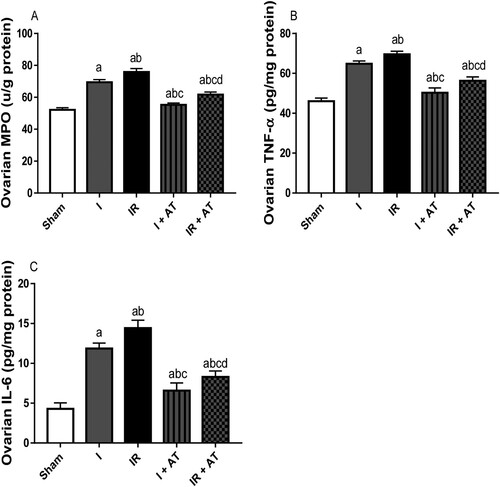
Figure 5. Effect of atorvastatin on markers of genotoxicity and apoptosis in ovarian I/R animal model. Data are presented as mean ± SD of 8 replicates per group. I: Ischaemia, I/R: Ischaemia/reperfusion, AT: Atorvastatin. a p < 0.05 versus sham, bp < 0.05 versus I, cp < 0.05 versus IR, dp < 0.05 versus I+ AT using one-way analysis of variance (ANOVA) followed by Tukey's post hoc test for pairwise comparison.
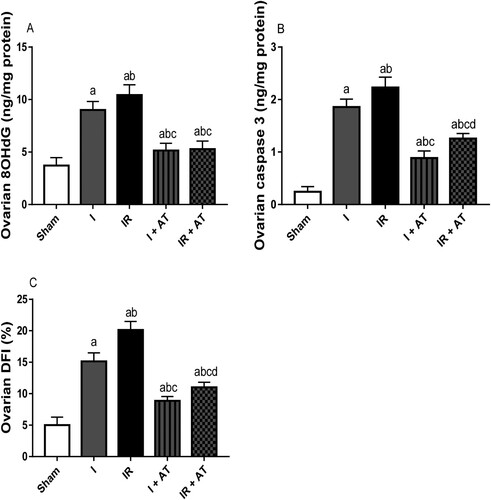
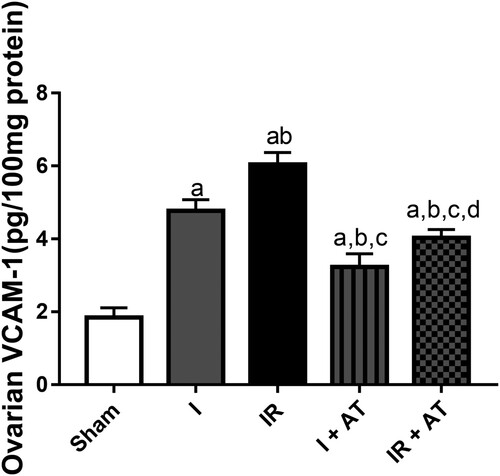
Figure 6. Effect of atorvastatin on vascular cell adhesion molecule (VCAM) in ovarian I/R animal model. Data are presented as mean ± SD of 8 replicates per group. I: Ischaemia, I/R: Ischaemia/reperfusion, AT: Atorvastatin. a p < 0.05 versus sham, bp < 0.05 versus I, cp < 0.05 versus IR, dp < 0.05 versus I+ AT using one-way analysis of variance (ANOVA) followed by Tukey's post hoc test for pairwise comparison.
Data availability
Data is available upon reasonable request.