
Figures & data
Figure 1. Effects of swinhoeic acid on the survival of mesangial cells with or without high glucose. (A) Chemical structure of swinhoeic acid. (B) Effects of swinhoeic acid on the viability of mesangial cells cultured in normal medium. (C) Effects of swinhoeic acid on the viability of mesangial cells under high glucose after 1 or 24 h. (D) Effects of swinhoeic acid on the proliferation of mesangial cells induced by high glucose. n = 3, #P < 0.05 and ##P < 0.01 vs control group, *P < 0.05 vs high glucose group.
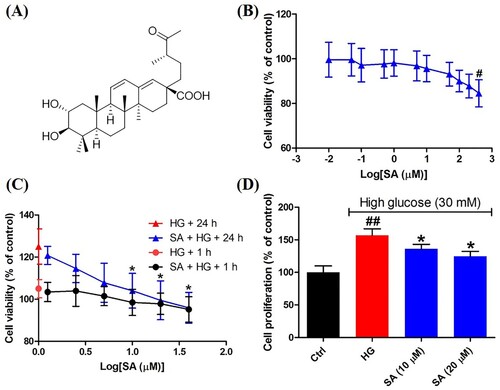
Figure 2. Effects of swinhoeic acid on the oxidative stress in mesangial cells under high glucose. (A) Intracellular ROS level. (B) MDA level. (C) SOD activity. (D) CAT activity. n = 3, #P < 0.05 and ###P < 0.001 vs control group, *P < 0.05, **P < 0.01 and ***P < 0.001 vs high glucose group, @@@P < 0.001 vs SA (20 μM) group.
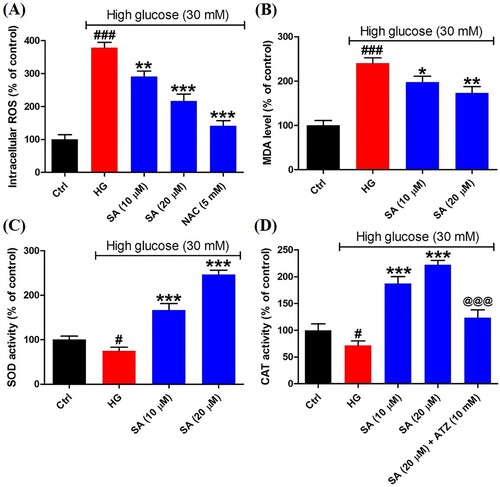
Figure 3. Effects of swinhoeic acid on the accumulation of ECM in mesangial cells under high glucose. (A)–(C) Synthesis of ECM proteins including collagen IV, fibronectin and laminin. (D)–(E) Secretion of TGF-β1 and CTGF. n = 3, ###P < 0.001 vs control group, *P < 0.05, **P < 0.01 and ***P < 0.001 vs high glucose group.
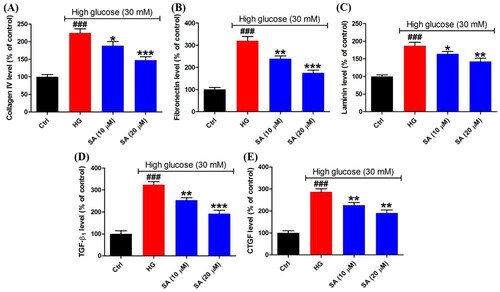
Figure 4. Effects of swinhoeic acid on the activation of Nrf2 in mesangial cells under high glucose. (A) Immunofluorescence staining, as the arrows indicated, the red fluorescence represented the intracellular Nrf2, blue fluorescence represented nuclei and the merged purple fluorescence represented the nuclear Nrf2. (B) Western blot analysis for nuclear and total Nrf2. (C)–(D) Densitometric analysis for nuclear and total Nrf2. (E) Dual luciferase assay for the capacity of Nrf2 binding to ARE. (F) HO-1 level. (G) Co-immunoprecipitation assay for Nrf2. n = 3, #P < 0.05 and ##P < 0.01 vs control group, ***P < 0.001 vs high glucose group.
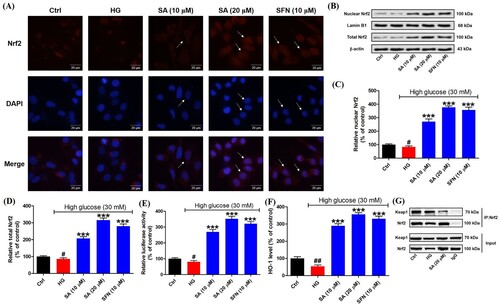
Figure 5. Nrf2 knockdown and effects on the survival of mesangial cells. (A) Western blot analysis and densitometric analysis for Nrf2 knockdown. (B) CCK-8 assay for the viability of mesangial cells transfected with NC-siRNA or Nrf2-siRNA cultured in normal medium. (C) CCK-8 assay for the viability of mesangial cells transfected with NC-siRNA or Nrf2-siRNA under high glucose. n = 3, #P < 0.05, ##P < 0.01 and ###P < 0.001 vs control group, *P < 0.05 vs high glucose group.
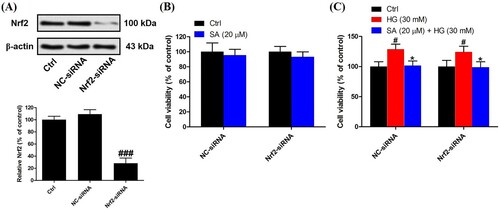
Figure 6. Role of Nrf2 activation in the effects of swinhoeic acid against accumulation of ECM. (A)–(C) Synthesis of collagen IV, fibronectin and laminin in mesangial cells transfected with NC-siRNA or Nrf2-siRNA under high glucose. (D)–(E) Secretion of TGF-β1 and CTGF in mesangial cells transfected with NC-siRNA or Nrf2-siRNA under high glucose. n = 3, ###P < 0.001 vs control group, **P < 0.01 and ***P < 0.001 vs high glucose group.
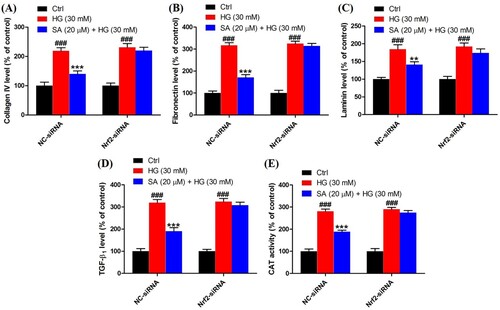
Figure 7. Role of Nrf2 activation in the effects of swinhoeic acid against oxidative stress. (A) Intracellular ROS level in mesangial cells transfected with NC-siRNA or Nrf2-siRNA under high glucose. (B) MDA level in mesangial cells transfected with NC-siRNA or Nrf2-siRNA under high glucose. (C)–(D) SOD and CAT activity in mesangial cells transfected with NC-siRNA or Nrf2-siRNA under high glucose. n = 3, #P < 0.05 and ###P < 0.001 vs control group, **P < 0.01 and ***P < 0.001 vs high glucose group.
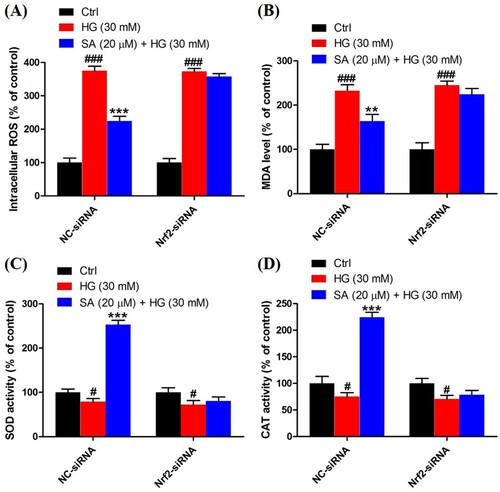
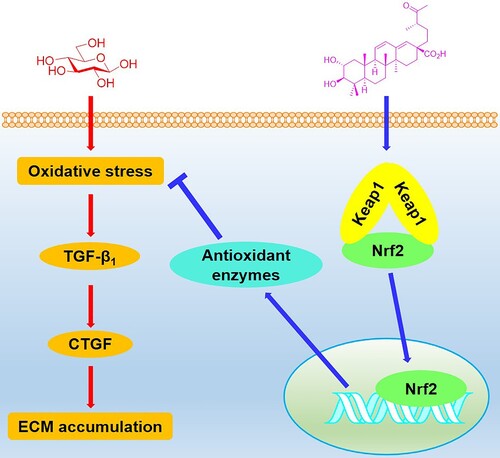
Figure 8. Schematic illustration for the effects of swinhoeic acid on mesangial cells under high glucose.
Data availability statement
The data in the current study are available from the corresponding author upon reasonable request.