
Figures & data
Figure 1. Cisplatin induces dysregulation of GSH metabolism in the renal tubules. (A) The enriched signaling pathways in cisplatin-induced kidneys using KEGG analysis, mmu: Mus musculus. (B, C) The total GSH level and GSH/GSSG ratio in the renal cortex of kidneys from saline (Control) or cisplatin-induced acute kidney injury mice (CAKI). (D, E) The total GSH and GSH/GSSG ratio levels in HK2 cells treated with different doses of cisplatin. Data are presented as mean ± S.E.M., *p<0.05. (F, G) The ROS level and quantification in HK2 cells treated with different doses of cisplatin. (H) Schematic illustration showing the GSH metabolism pathway. (I, J) The protein expressions of GSS, GSR, and GPX4 in the renal cortex of the kidneys from saline or cisplatin-treated C57BL/6J mouse (n = 3 per group) or in the cell lysate of PBS or cisplatin-treated HK2 cells using immunoblot. Statistical significance between the two groups as indicated was determined using an unpaired two-tailed Student’s t-test. The experiments were repeated at least in triplicate.
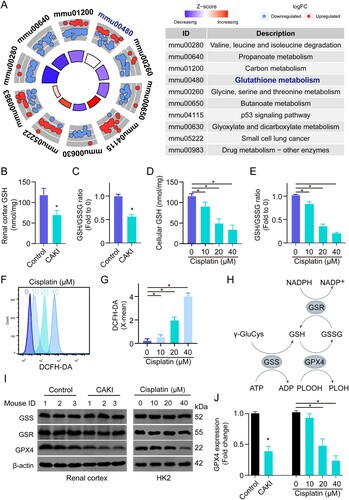
Figure 2. Cisplatin induces renal tubule cell both apoptosis and ferroptosis. (A) Cell viability was detected in HK2 cells treated with different doses of cisplatin for 24, 48, and 72 h. (B) IC50 of cisplatin on HK2 cells at the time point of 24 h was determined. (C) Cell viability was detected in HK2 cells treated with 10 μM ferrostatin-1 or Z-VAD-FMK in the presence or absence of 15 μM of cisplatin for 24 h. (D) Cell ferroptosis were analysed in HK2 cells treated with 15 μM of cisplatin with the addition of 10 μM ferrostatin-1. (E) Cell apoptosis was analysed in HK2 cells treated with 15 μM of cisplatin with the addition of 10 μM Z-VAD-FMK. The experiments were at least in triplicate. IHC staining of apoptotic marker cleaved caspase 3 (F) and ferroptosis marker 4HNE (G) on the kidney from C57BL/6J mice treated with or without 30 mg/kg cisplatin for 72 h. Data are mean ± S.E.M. Statistical significance between the two groups as indicated was determined using an unpaired two-tailed Student’s t-test, n = 5, *p<0.05.
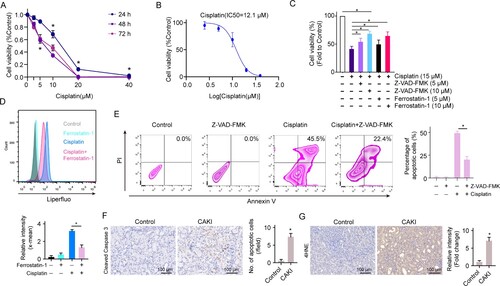
Figure 3. Cisplatin induces activation of IL6/JAK/STAT3 signaling. (A) GSEA analysis showed the enriched signaling pathways in the cisplatin-induced mouse kidney. (B) IL6-JAK-STAT3 signaling was upregulated and oxidative phosphorylation was downregulated in cisplatin-induced mouse kidneys using GSEA analysis. (C) The total IL6 level in HK2 cells was treated with different doses of cisplatin (0-40 μM) for 24 h. (D) The expressions of STAT3 and phospho-STAT3 (p-STAT3) in HK2 cells were treated with different doses of cisplatin (0-40 μM) for 24 h. (E-G) The total GSH level (E) and GSH/GSSG ratio (F) expression of JAK2, p-JAK2, STAT3, and p-STAT3 (G) in HK2 cells treated with 15 μM cisplatin in the presence or absence of 10 μM NAC. The experiments were repeated at least in triplicate. Data are presented as mean ± S.E.M. Statistical significance between the two groups as indicated was determined using an unpaired two-tailed Student’s t-test, *p<0.05.
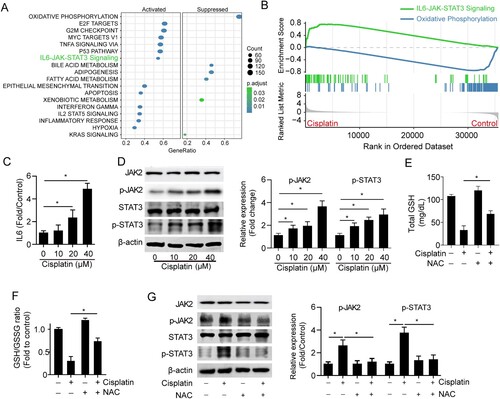
Figure 4. Inhibition of JAK/STAT3 protects against cisplatin nephrotoxicity. Cell apoptosis (A) and ferroptosis (B) were detected in HK2 cells treated with 15 μM of cisplatin in the presence or absence of 10 μM S3I-201 or 10 μM ruxolitinib for 24 h. Mice injected with cisplatin (30 mg/kg) or cisplatin (30 mg/kg) plus S3I-201 (5 mg/kg) or the same amount of PBS. The levels of BUN (C) and creatinine (D) were determined in serum collected from C57BL/6J mice at 0, 24, 48, and 72 h. The levels of GSH (E) and GSH/GSSG ratio (F) were determined in the renal cortex of C57BL/6J mice 72 h after cisplatin treatment. (G) IHC staining and quantification of cleaved caspase 3 and 4HNE on the kidneys from each group of mice. Statistical significance between the two groups as indicated was determined using an unpaired two-tailed Student’s t-test. Data are presented as mean ± S.E.M., n = 5, *p<0.05.
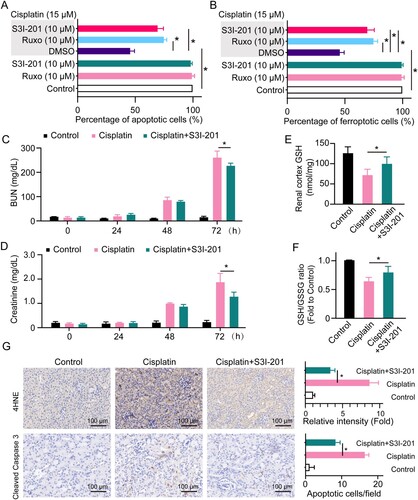
Figure 5. Baicalein protects renal function against cisplatin nephrotoxicity. (A) Cell viability was detected in HK2 cells treated with different doses (0-40 μM) of baicalein for 24 h. (B) Cell viability was detected in HK2 cells treated with 15 μM of cisplatin in the presence or absence of different doses (0-20 μM) of baicalein as indicated for 24 h. Cell apoptosis (C) and ferroptosis (D), expressions of the JAK/STAT signaling-associated proteins (E) were detected in HK2 cells treated with 15 μM of cisplatin in the presence or absence of 5 μM baicalein for 24 h. Mice were injected with cisplatin (30 mg/kg) or cisplatin (30 mg/kg) plus baicalein (10 mg/kg) or the same amount of PBS. BUN (F) and creatinine (G) levels were determined in serum collected from C57BL/6J mice at 0, 24, 48, and 72 h. (H) IHC staining and quantification of cleaved caspase 3 and 4HNE on the kidneys from each group of mice. (I) expressions of the JAK/STAT signaling-associated proteins (E) were detected in the kidney cortex from each group of mice. Statistical significance between the two groups as indicated was determined using an unpaired two-tailed Student’s t-test. Data are presented as mean ± S.E.M., n = 5, *p<0.05.
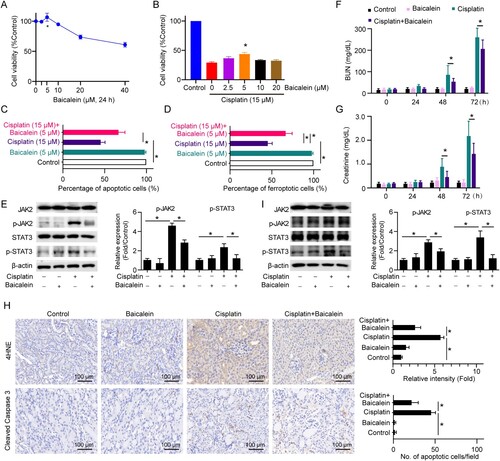
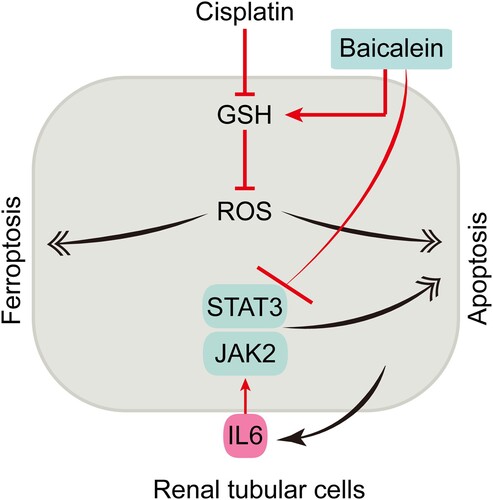
Figure 6. Schematic model for the mechanism of action under cisplatin nephrotoxicity. Cisplatin induces both apoptosis and ferroptosis in renal tubular cells by disrupting GSH metabolism leading to apoptosis and ferroptosis. Targeting JAK/STAT3 and/or GSH repletion using baicalein attenuates tubular cell apoptosis and ferroptosis and inhibits cisplatin nephrotoxicity.
Data availability statement
The data presented in this study are available upon request from the corresponding author.