
Figures & data
Figure 1. Hypoxia results in the downregulation of CSE expression in adrenal glands and reduces adrenocortical responsiveness to ACTH. (A) The mice underwent hypoxia for 24 and 72 h, respectively. ACTH stimulation test was applied to examine adrenocortical responsiveness. Left panel: Increase in corticosterone levels from baseline after ACTH stimulation at 15, 60 and 120 min. Right panel: The dynamic curve of ACTH stimulation test. Data were expressed as mean ± SEM. n = 8 in each group. **P < 0.01. (B) The mice underwent sham and ADX. One week later, all mice were administered with LPS at the dose of 30 mg/kg under normoxia and hypoxia. The mortality rate was determined. n = 10 in each group. **P < 0.01. (C) The mice underwent hypoxia for 24 and 72 h, respectively. The adrenal tissues were obtained for the determination of CBS and CSE protein expression using western blotting analysis. Left panel: Representative images of western blotting. Right panel: Statistical graph of western blotting. Data were expressed as mean ± SEM. n = 8 in each group. *P < 0.05. (D) The mice with hypoxia for 72 h were treated with GYY4137 at the dose of 133μmol/kg/day. ACTH stimulation test was applied to examine adrenocortical responsiveness. Data were expressed as mean ± SEM. n = 8 in each group. *P < 0.05, **P < 0.01.
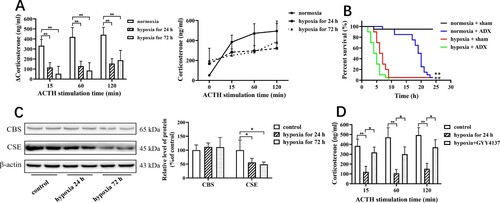
Figure 2. Hypoxia causes NLRP3 inflammasome activation and pyroptosis in adrenal gland and GYY4137 treatment reverses them. (A) NLRP3 protein expression in the adrenal gland of WT and Cse-/- mice was analyzed by immunocytochemistry. Representative images of NLRP3 in the adrenal gland of WT and Cse-/- mice. Arrows indicate NLRP3-positive staining. (B and C) WT mice with hypoxia for 72 h were treated with GYY4137 at the dose of 133 μmol/kg/day. The levels of NLRP3, Caspase-1 and cleaved caspase-1 p20 (B) and the levels of GSDMD and GSDMD N-terminal (C) in adrenal glands of the mice with or without GYY4137 treatment were determined by western blotting analysis. Data were expressed as mean ± SEM. n = 8 in each group. **P < 0.01.
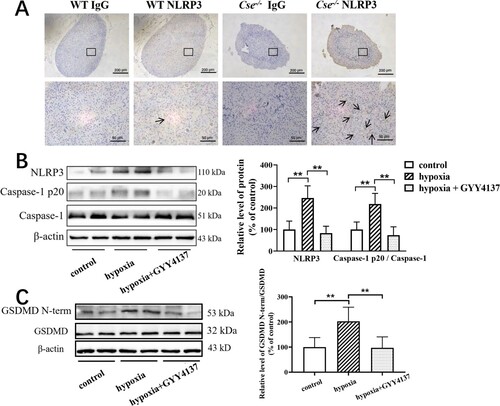
Figure 3. GYY4137 treatment reverses hyo-adrenocortical responsiveness, NLRP3 inflammasome activation and pyroptosis in adrenal glands in Cse-/- mice. Cse-/- mice were administered with GYY4137 at the dose of 133μmol/kg/day for 72 h. ACTH stimulation test was applied to examine adrenocortical responsiveness. The adrenal tissues were obtained for determination of CBS and CSE protein expression using western blotting analysis. (A) ACTH stimulation test. Left panel: Increase in corticosterone levels from baseline after ACTH stimulation at 15, 60 and 120 min. Right panel: The dynamic curve of ACTH stimulation test. (B) The protein expression of NLRP3, caspase-1, Caspase-1 p20, GSDMD and GSDMD N-terminal in adrenal glands. Left panel, Representative western blot analysis of NLRP3, Caspase-1, Caspase-1 p20, GSDMD and GSDMD N-terminal in adrenal glands. Right panel, The statistical graph of western blot results. Data were expressed as mean ± SEM. n = 8 in each group *p < 0.05, **P < 0.01.
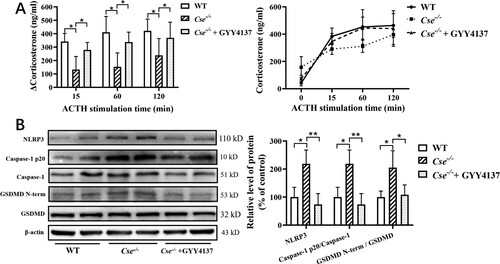
Figure 4. Hypoxia and CSE deficiency result in a decrease in S-sulfhydration of PSMA7 level in the adrenal gland. (A) WT mice with hypoxia for 72 h were treated with GYY4137 at the dose of 133μmol/kg/day. Biotin-switch assay was applied to determine the S-sulfhydration of PSMA7 level in adrenal glands. Left panel: The representative image of S-sulfhydration of PSMA7. Right panel: Statistical graph. (B) Cse-/- mice were administered with GYY4137 at the dose of 133μmol/kg/day for 72 h. A biotin-switch assay was applied to determine the S-sulfhydration of PSMA7 level in adrenal glands. Left panel: The representative image of S-sulfhydration of PSMA7. Right panel: Statistical graph. Data were expressed as mean ± SEM. n = 8. *P < 0.05, **P < 0.01.
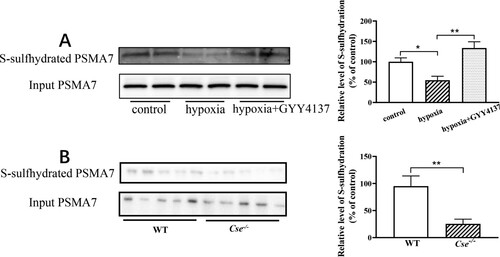
Table 1. Mass spectrometry analysis of the S-sulfhydrated proteins.
Figure 5. PSMA7 S-sulfhydration modulates NLRP3 expression in adrenocortical cells. (A) Y1 cells were treated with IAA (2 mM) or vehicle for 24 h and then harvested for the determination of NLRP3 protein expression. Left panel: The representative image of NLRP3. Right panel: Statistical graph. (B) Y1 cells were transfected with WT and various mutants of PSMA7. Left panel: The representative image of NLRP3. Right panel: Statistical graph. The cells were then harvested for the determination of NLRP3 protein expression. Data were expressed as mean ± SEM. n = 4 independent cultures. **P < 0.01.
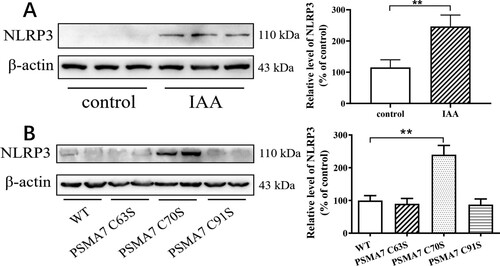
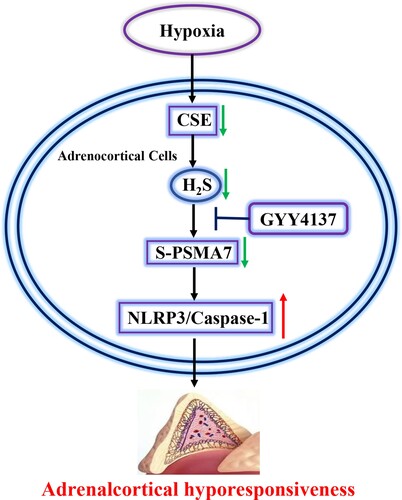
Figure 6. Working model: Hypoxia causes downregulation of CSE expression and reduced H2S level, which leads to reduced S-sulfhydration of PSMA7 at Cys70. Reduced S-sulfhydration of PSMA7 results in NLRP3 inflammasome activation in adrenal glands, thereby leading to adrenocortical insufficiency.
Data availability statement
The data used to support the findings of this study are available from the corresponding author upon request.