
Figures & data
Figure 1. Effects of liraglutide on the acetylcholine-induced relaxation of the aorta from LDLR-KO mice and the role of exendin-9. After 1 h of incubation, the aortic rings were precontracted with norepinephrine (10−5 M), and then the rings were exposed to a cumulative concentration of acetylcholine (10−9–10−5 M) to test the endothelial-dependent vasodilation. LIR indicates liraglutide. EXE indicates exendin-9. Results are mean ± SE, n = 4 in each group, *P < 0.05 compared to wild-type at the same concentration, #P < 0.05 compared to LDLR-KO at the same concentration.
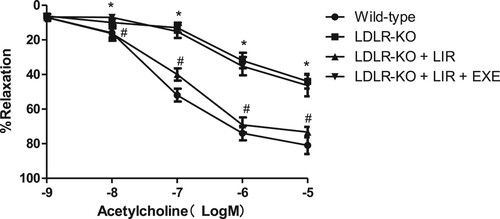
Figure 2. Effects of liraglutide on the circulatory levels of ox-LDL, oxidative and inflammatory markers, and NO bioavailability in LDLR-KO mice and the role of exendin-9. LIR indicates liraglutide. EXE indicates exendin-9. Results are mean ± SE, n = 10 in each group, *P < 0.05 compared to wild-type mice, #P < 0.05 compared to LDLR-KO mice, &P < 0.05 compared to liraglutide-treated LDLR-KO mice.
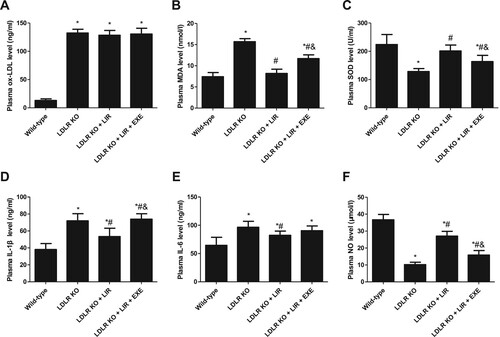
Figure 3. Effect of liraglutide on the LOX-1 expression in the thoracic aorta from LDLR-KO mice and the role of exendin-9. LIR indicates liraglutide. EXE indicates exendin-9. The results of three independent experiments were expressed as mean ± SE. *P < 0.05 compared to wild-type mice, #P < 0.05 compared to LDLR-KO mice, &P < 0.05 compared to liraglutide-treated LDLR-KO mice.
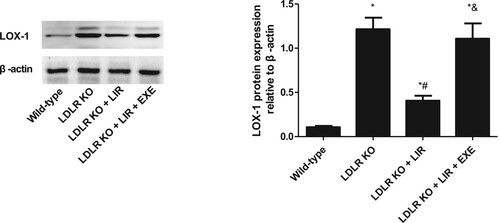
Figure 5. Effect of liraglutide on ox-LDL-induced LOX-1-mediated ROS generation. Cells transfected with pcDNA3.1 null control or pcDNA3.1-LOX-1 were treated with 20 µg/mL ox-LDL alone or combined with 1000 nM liraglutide and intracellular ROS levels were determined by flow cytometry. The results of three independent experiments were expressed as mean ± SE. *P < 0.05 compared to control, #P < 0.05 compared to ox-LDL group, &P < 0.05 compared to ox-LDL + liraglutide group.
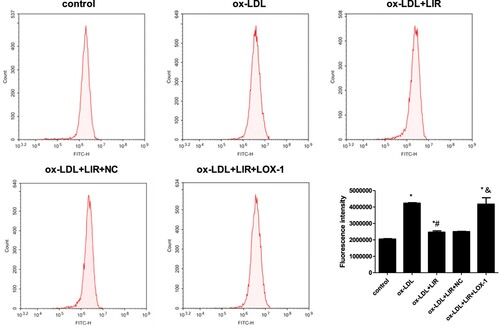
Figure 6. Effect of liraglutide on ox-LDL-induced LOX-1-mediated upregulation of ICAM-1 and VCAM-1. Cells transfected with pcDNA3.1 null control or pcDNA3.1-LOX-1 were treated with 20 µg/mL ox-LDL alone or combined with 1000 nM liraglutide and ICAM-1 and VCAM-1 level was determined by ELISA assay. The results of three independent experiments were expressed as mean ± SE. *P < 0.05 compared to control, #P < 0.05 compared to ox-LDL group, &P < 0.05 compared to ox-LDL + liraglutide group.
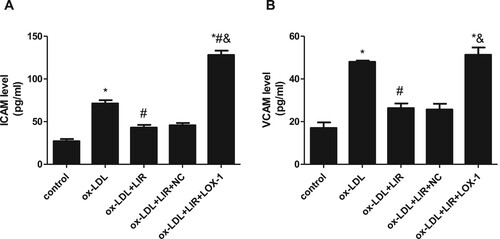
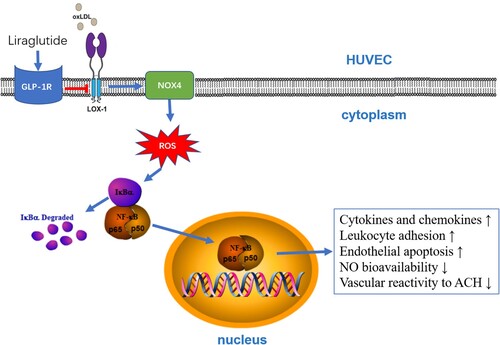
Figure 8. Schematic diagram illustrating the proposed signaling pathway involved in the protective effect of liraglutide against ox-LDL-associated endothelial dysfunction.
Data availability statement
The data that support the findings of this study are available on request from the corresponding author.