
Figures & data
Figure 1. Effect of H2O2 addition on expression of various genes. A. Human 1.1B4 cells were treated with H2O2 as described in and Supplemental Material. For RT-qPCR analysis of CAT under Condition A described in the Supplemental Material, 12 RNA samples from the two groups obtained for microarray were used, and the value obtained was the expression ratio to GAPDH expression. (* indicates a significant difference of p < 0.05 by t-test). B-F. Levels of HMOX1, FOSB, KEAP1, NR4A3, and EGR1, respectively, were measured.
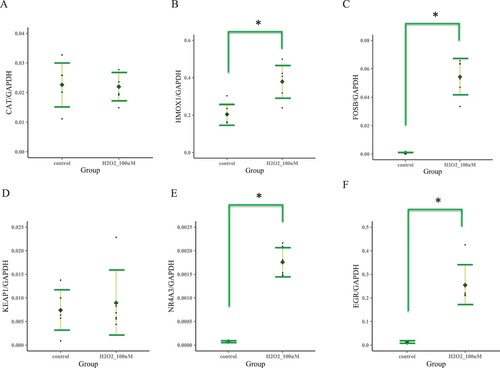
Figure 2. Effect of H2O2 concentration on NR4A3 gene expression and time course of expression. A. Human 1.1B4 cells (1.0 × 10⁵ cells/ml) were incubated in 2 ml of culture medium, and 24 h later, the medium was changed to individual concentrations of H2O2-containing medium. After 4 as well as 24 h, total RNA was extracted using Isogen reagent. The expression of NR4A3 was measured by RT-qPCR under Condition B (n = 3) described in the Supplemental Material. B. After addition of 100 µM H2O2, the cells were incubated for various time periods and RNA was extracted (n = 3). ß-Actin was used as a control. (* p < 0.05, ** p < 0.01).
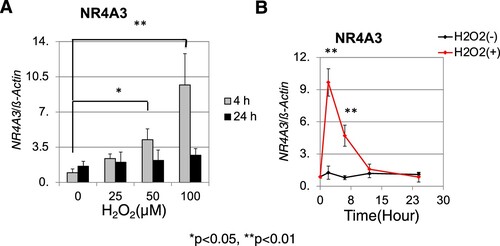
Figure 3. Effect of siRNA targeting NR4A3 on cell viability. A. After addition of siNR4A3 to 1.1B4 cells, total RNA was extracted and expression of NR4A3 was measured by RT-qPCR using the Cyber green method under Condition B described in the Supplemental Material (n = 3; * p < 0.05). B. After addition of siNR4A3, the 1.1B4 cells were incubated with 100 mM of H2O2, and cell viability was measured by MTT assay (n = 5). NFW: nuclease free water-added cell; siNR4A3: siRNA of NR4A3-treated cell.
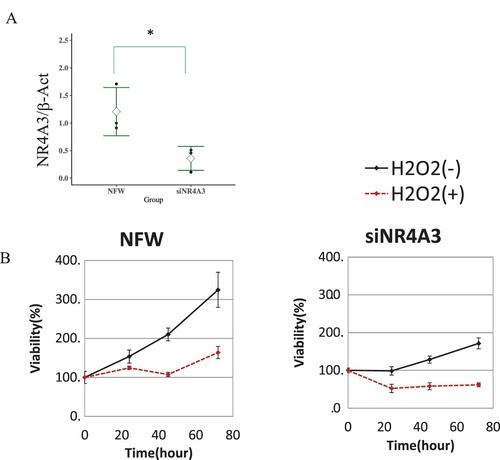
Table 1. Comparison of the expression between H2O2-treated 1.1B4 cells and control cells using microarray and RT-qPCR.
Figure 4. Changes in gene expression in response to NR4A3 siRNA treatment and H2O2 treatment measured by RT-qPCR. RT-qPCR conditions are described in and Supplemental Material. A. NR4A3. B. HMOX1. C. GLRX. D. CDK2. E. EGR1. Pairwise t tests were used for the statistical analysis of post-hoc tests between NFW and siNR4A3 (* p < 0.05).
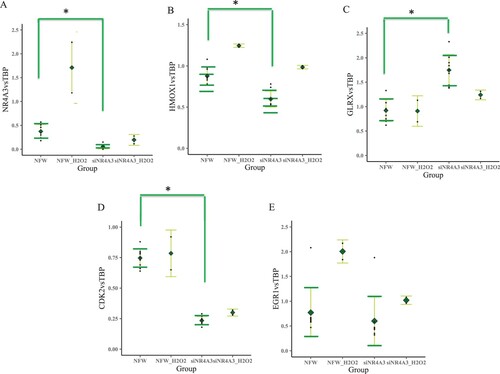
Table 2. Changes in gene expression in 1.1B4 cells in response to NR4A3 siRNA treatment and H2O2 treatment, measured by microarray and RT-qPCR.
Data availability statement
The datasets are available from the corresponding author upon reasonable request.