
Figures & data
Figure 1. MLT Significantly inhibited the proliferation of RCC In vivo and in vitro. (A, B, C) Relative cell viability of 786-O, 769-P and SW839 cells treated with MLT at different concentrations for 24 h was measured by MTT assays. (D) 786-O, 769-P and SW839 cells treated with MLT at different concentrations for 24 h. Cells were stained with trypan blue, and the number of the cells is shown for different group. (E) Colony formation test of RCC cells after treated with MLT. (F) The nude mouse body weight was measured every 2 days with/without MLT treatment. (G) The nude mouse tumor volume was measured every 2 days with/without MLT treatment. (H) After sacrificing, tumors were isolated and photographed after treatment with/without MLT for 12 days. (I) After sacrificing, tumors were isolated and weighted after treatment with/without MLT for 12 days. (J) The level of ATP in mouse tumors was measured (n = 3, mean ± SD).
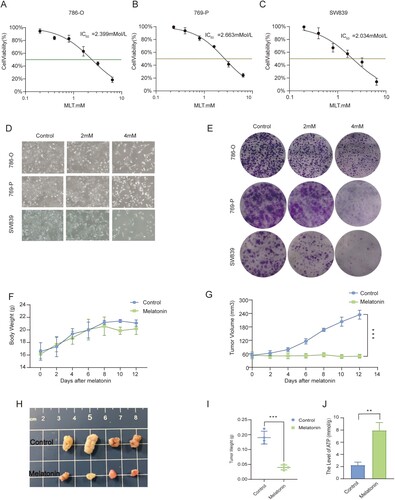
Figure 2. MLT treatment increased ROS production and inhibited antioxidase activities in RCC cells. (A) ROS production in RCC cells were detected by fluorescence staining. Scale bar = 50 μm. (B, C, D, E) Flow cytometry analysis of the ROS amount and quantitative analysis of intracellular ROS detection. (n = 3, mean ± SD). (F) SOD activity in 786-O, 769-P and SW839 cells after treatment with MLT 24 h; (n = 3, mean ± SD). (G) GSH activity in 786-O, 769-P and SW839 cells after treatment with MLT 24 h; (n = 3, mean ± SD). (H) GSH-PX activity in 786-O, 769-P and SW839 cells after treatment with MLT 24 h; (n = 3, mean ± SD). (I) CAT activity in 786-O, 769-P and SW839 cells after treatment with MLT 24 h; (n = 3, mean ± SD). *p < 0.05; **p < 0.01, and ***p < 0.001 vs control group.
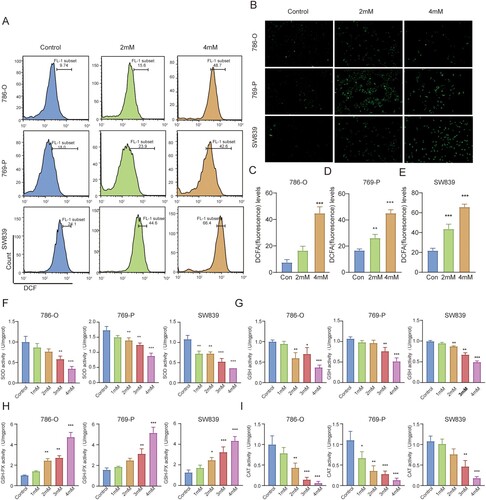
Figure 3. MLT Significantly promotes apoptosis of RCC and and is attenuated by NAC. (A) The RCC cells were treated with different doses of MLT for 24, and then protein expression was detected by western blotting analysis. (B) 786-O, 769-P and SW839 cells were pretreated with MLT (0, 2, and 4 mM) for 24 h, and cell apoptosis was detected by flow cytometry analysis. (C) Western blot analysis of the expression levels of apoptosis related proteins after 786-O, 769-P and SW839 cells treated with MLT (4 mM) and ROS inhibitor NAC (5 mM). (D) The apoptotic cell number changes in 786-O, 769-P and SW839 cells after treatment with MLT (4 mM) and ROS inhibitor NAC (5 mM) as detected by flow cytometry assay. (E) Representative images showing immunofluorescence of staining for TUNEL and in RCC cell xenografts (scale bar = 20 μm).
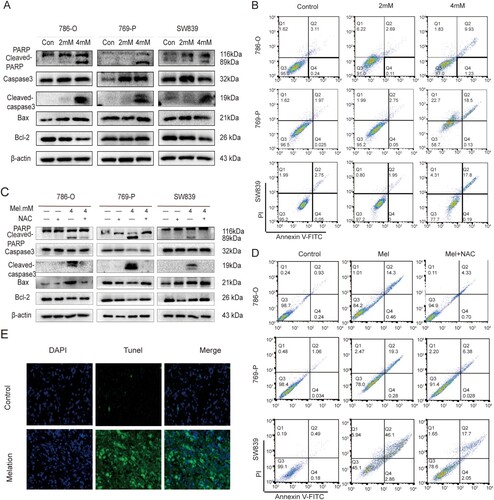
Figure 4. MLT treatment up-regulated key TCA cycle metabolites while reduced aerobic glycolysis products in RCC cells. (A) Heatmap of the metabolomic analysis in 786-O cells between MLT-treated groups vs. control group. (B, C, D, E, F, G) Metabolomic analysis of intracellular levels of Acetyl-CoA, citrate, isocitrate, succinate, pyruvate and lactate respectively, as detected using UPLC-MS/MS. (n = 3, mean ± SD). * p < 0.05; ** p < 0.01 and *** p < 0.001 vs control group.
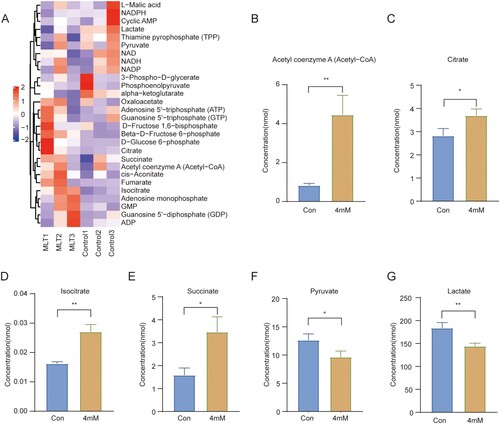
Figure 5. MLT treatment enhanced mitochondrial function in RCC cells. (A, B, C) OCR level of 786-O, 769-P and SW839 cells pretreated with different dose of MLT for 24h as measured by seahorse analyzer Oligomycin A, Fccp, and Rotenone/Antimycin A (n = 5, mean ± SD). (D, E, F) The basal respiration in 786-O, 769-P, and SW839 cells respectively. (n = 5, mean ± SD). (G, H) The mitochondrial membrane potential changes in 786-O, 769-P, and SW839 cells after treatment with MLT for 24 h, as detected by flow cytometry analysis, and the quantification of JC-1 green is shown in bar graph (H), in which the lower JC-1 green indicates the higher membrane potential. (n = 3, mean ± SD). (I) Fluorescence diagrams of mitochondrial membrane potential with RED and GREEN changes in 786-O, 769-P and SW839 cells after treatment with MLT for 24h, in which the lower JC-1 Green/Red ration indicates the higher membrane potential. Scale bar = 50 μm. (J, K, L) Level of ATP in 786-O, 769-P and SW839 cells after treatment with MLT at different concentrations, respectively. (n = 3, mean ± SD). * p < 0.05; ** p < 0.01 and *** p < 0.001 vs control group.
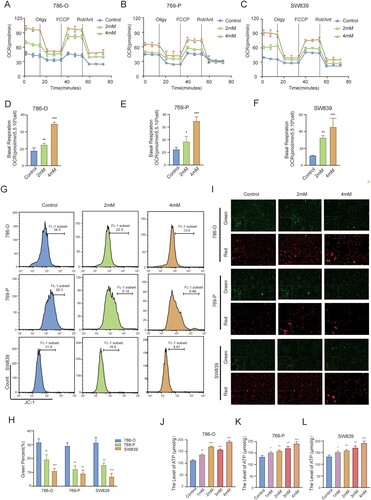
Figure 6. MLT induced cell apoptosis via regulating the ROS-mediated suppression of Akt/mTOR/S6K signaling pathway. (A) Western blot analysis of Akt, p-Akt and mTOR, p-mTOR, p-p70 S6 Kinase (Thr389/Ser371) and β-actin expression, after 786-O, 769-P and SW839 cells were treated with different concentrations MLT for 24 h. (B) Western blot analysis of the expression levels of HIF-1ɑ and VEGF after 786-O, 769-P and SW839 cells treated with MLT (4 mM) and ROS inhibitor NAC (5 mM). (C) Western blot analysis of the expression Akt, p-Akt and mTOR, p-mTOR, p-p70 S6 Kinase (Thr389/Ser371), and β-actin after RCC cells treated with MLT (4 mM) and ROS inhibitor NAC (5 mM). (D) Representative images showing immunocytochemical of staining for HE, Ki-67 and p-Akt in RCC cell xenografts (scale bar = 20 μm). (E) Schematic diagram of how melatonin causes apoptosis in RCC cells.
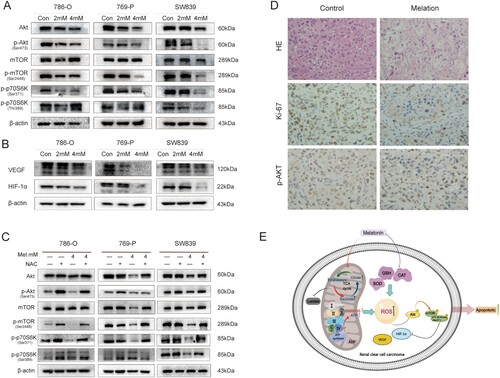
Figure 7. Sunitinib enhances the Warburg effect in RCC. (A) Relative cell viability of 786-O, 769-P and SW839 cells treated with sunitinib at different concentrations for 24 h was measured by MTT assays. (B) Pyruvate activity in 786-O, 769-P and SW839 cells after treatment with sunitinib for 24 h; (n = 3, mean ± SD). (C, D) OCR and ECAR level of 786-O, 769-P and SW839 cells pretreated with different dose of sunitinib for 24h as measured by seahorse analyzer. (E) The basal respiration in 786-O, 769-P, and SW839 cells respectively. (n = 5, mean ± SD). ** p < 0.01 and *** p < 0.001 vs control group.
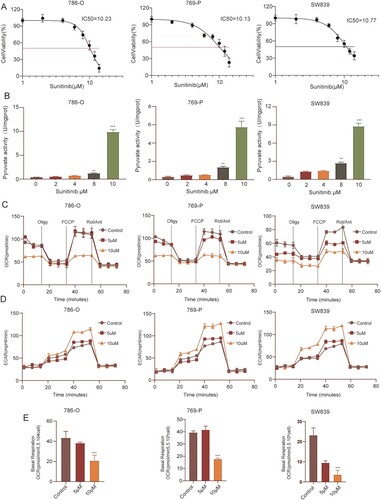
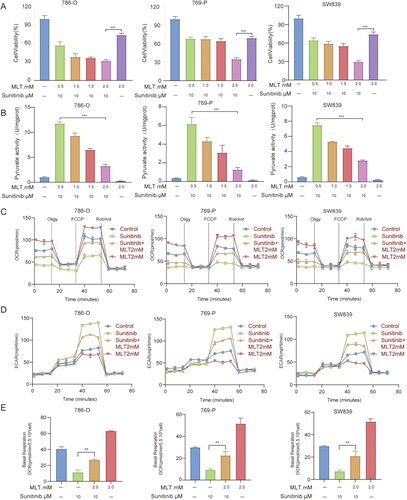
Figure 8. MLT enhances effects of sunitinib, reversing the Warburg effect in RCC. (A) Relative cell viability of 786-O, 769-P and SW839 cells treated with sunitinib and MLT at different concentrations for 24 h was measured by MTT assays. (B) Pyruvate activity in 786-O, 769-P and SW839 cells after treatment with MLT and sunitinib for 24 h; (n = 3, mean ± SD). (C, D) OCR and ECAR level of 786-O, 769-P and SW839 cells pretreated with different dose of sunitinib and MLT for 24h as measured by seahorse analyzer. (E) The basal respiration in 786-O, 769-P, and SW839 cells respectively. (n = 5, mean ± SD). ** p < 0.01 and *** p < 0.001 vs control group.
Supplemental Material
Download TIFF Image (1.1 MB)Supplemental Material
Download TIFF Image (1.5 MB)Supplemental Material
Download TIFF Image (3.4 MB)Data availability
The data and materials during the current study are available from the corresponding author on reasonable request.