
Figures & data
Figure 1. The chemical structure of Mito-TSG.
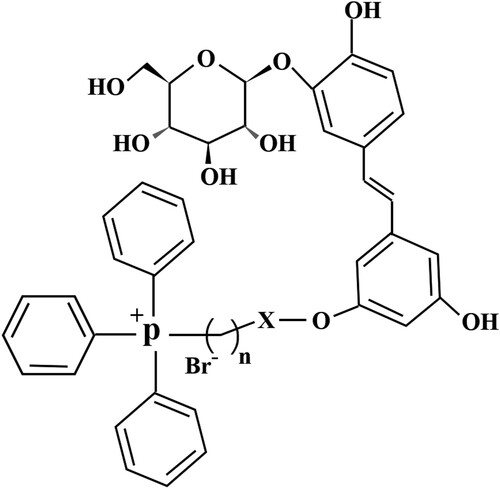
Figure 2. Morris water maze navigation experiment was performed in blank control group, model group, TSG group and Mito-TSG group (mean ± SD, n = 20). (A) Escape latency, (B) Total distance of activities, (C) Number of platform. # P<0.05, comparison with control group;*P<0.05, comparison with model group;▴P<0.05, comparison with TSG group.
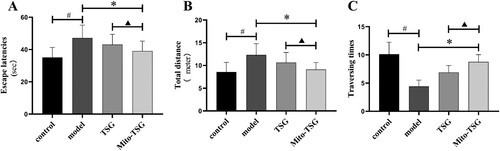
Figure 3. Typical electron micrographs. (A) control group, (B) model group, (C)TSG group, (D) Mito-TSG group. A2, D2 × 5.0k. A1, B1, B2, C2 × 8.0k. C1, D1 × 12.0k.
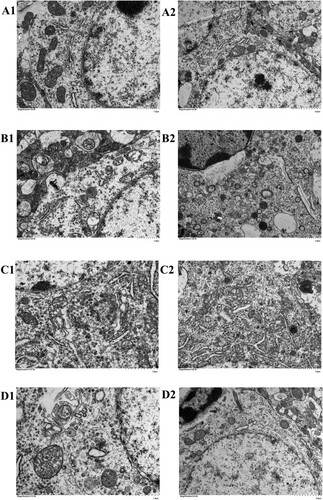
Figure 4. The changes of mitochondrial membrane potential in control group, model group, TSG group and Mito-TSG (mean ± SD, n = 10). (A) control group, (B) model group, (C) TSG group, (D) Mito-TSG group, (E) Changes in mitochondrial membrane potential in various groups. # P<0.05, comparison with control group; *P<0.05, comparison with model group;▴P<0.05, comparison with TSG group;
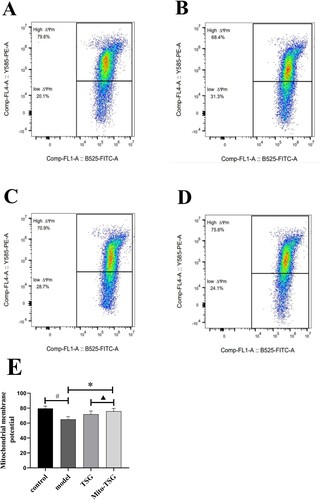
Figure 5. The changes of H2O2, NO and MDA in control group, model group, TSG group and Mito-TSG (mean ± SD, n = 10). (A) changes in H202, (B) changes in NO, (C) changes in MDA. # P<0.05, comparison with control group; *P<0.05, comparison with model group;▴P<0.05, comparison with TSG group.
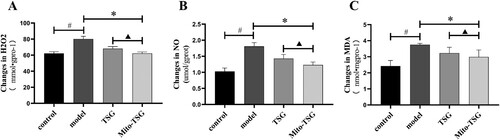
Figure 6. LD content and LDH activity in the control group, model group, TSG group and Mito-TSG (mean ± SD, n = 10). (A) LD content, (B) LDH activity. #P<0.05, comparison with control group; *P<0.05, comparison with model group;▴P<0.05, comparison with TSG group.
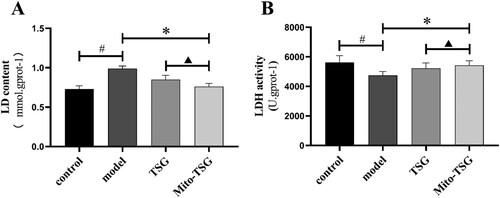
Figure 7. The activity of SOD, CAT and GSH-Px in the control group, model group, TSG group and Mito-TSG (mean ± SD, n = 10). (A) activity of SOD, (B) activity of CAT, (C) activity of GSH-Px. #P<0.05, comparison with control group; *P<0.05, comparison with model group;▴P<0.05, comparison with TSG group.
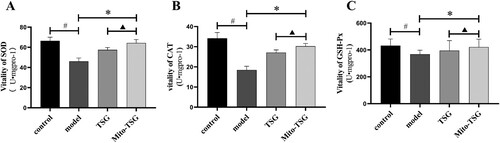
Figure 8. The protein expression of Bax, Bcl2 and Caspase-3 in control group, model group, TSG group and Mito-TSG group (mean ± SD, n = 10). (A) The results from the Western Blot, (B) Quantitative analysis for the protein level of caspase-3, (C) Quantitative analysis for the protein level of bcl-2, (D) Quantitative analysis for the protein level of bax. #P<0.05, comparison with control group; *P<0.05, comparison with model group; ▴P<0.05, comparison with TSG group.
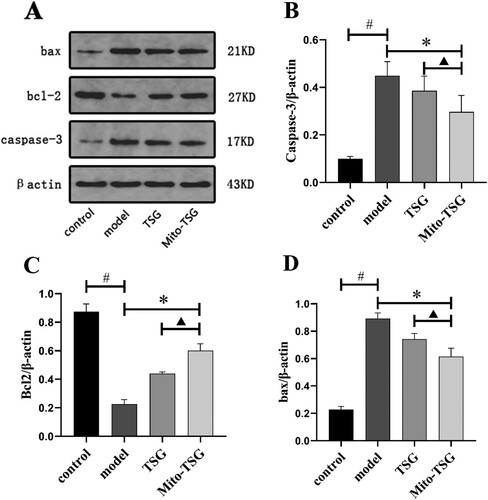
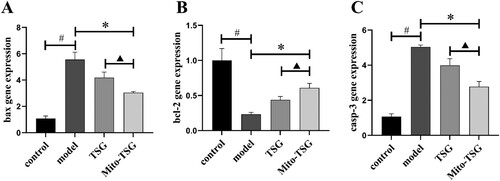
Figure 9. The gene expression of Bax, Bcl2 and Caspase-3 in control group, model group, TSG group and Mito-TSG group (mean ± SD, n = 10). (A) gene expression of bax, (B) gene expression of bcl-2, (C) gene expression of caspase-3. #P<0.05, comparison with control group; *P<0.05, comparison with model group; ▴P<0.05, comparison with TSG group.
Data availability statement
The data that has been used is confidential.