
Figures & data
Figure 1. Changes in body weight (A) and kidney weight (B) of rats treated with MTX with or without L-Met. Values are presented as mean ± SEM (n = 6). Significant differences (P < 0.05) between groups were indicated by different letters above the error bars. Similar letters above the error bars indicate no significant differences. Abbreviations: L-Met, L-methionine; MTX, methotrexate.
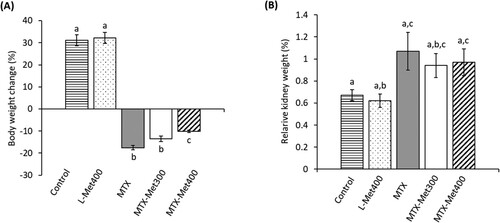
Table 1. Changes in serum biochemical parameters related to kidney function and injury under the influence of MTX with and without L-Met.
Figure 2. Oxidative markers in rats treated with MTX with and without L-Met. Renal ROS (A); MDA (B); NO (C) and PC (D) levels were evaluated for different groups. Values are presented as mean ± SEM (n = 6). Significant differences (P < 0.05) between groups were indicated by different letters above the error bars. Similar letters above the error bars indicate no significant differences. Abbreviations: L-Met, L-methionine; MTX, methotrexate; MDA, malondialdehyde; NO, nitric oxide; PC, protein carbonyl; ROS, reactive oxygen species.
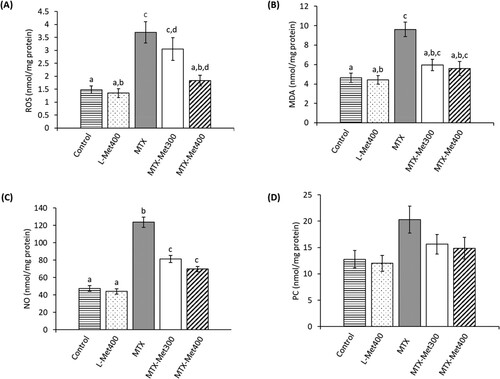
Figure 3. Antioxidant markers in rats treated with MTX with and without L-Met. Different groups were evaluated for their level of renal GSH (A); GSSG (B), GSH/GSSG ratio (C), the activities of GPx (D); CAT (E); and SOD (F). Values are presented as mean ± SEM (n = 6). Significant differences (P < 0.05) between groups were indicated by different letters above the error bars. Similar letters above the error bars indicate no significant differences. Abbreviations: CAT, catalase; GPx, glutathione peroxidase; GSH, reduced glutathione; GSSG, oxidized glutathione; L-Met, L-methionine; MTX, methotrexate; SOD, superoxide dismutase.
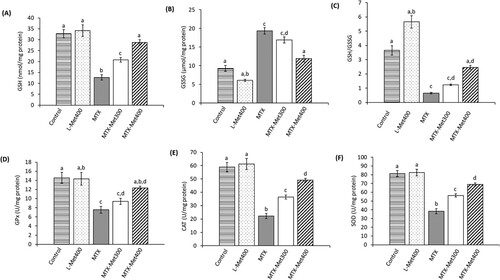
Figure 4. Inhibitory effect of L-Met on MTX-induced inflammatory cytokines in rats. Different groups were assessed for their levels of IL-1β (A); IL-6 (B); and TNF-α (C). Values are presented as mean ± SEM (n = 6). Significant differences (P < 0.05) between groups were indicated by different letters above the error bars. Similar letters above the error bars indicate no significant differences. Abbreviations: IL, interleukin; L-Met, L-methionine; MTX, methotrexate; TNF, tumor necrosis factor.
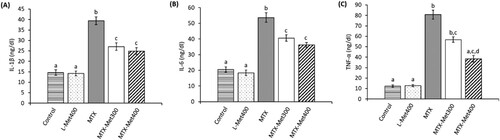
Table 2. Changes in rats’ blood cell counts under the influence of MTX with and without L-Met.
Table 3. Changes in the differential leucocytic count of rats under the influence of MTX with and without L-Met.
Data availability statement
The data used to support the findings of this study are available from the corresponding author upon request.