
Figures & data
Figure 1. Gln alleviates tissue injury, promotes redox balance, and restores ATP generation in the liver of burn septic mice. (A) Time flow of burn sepsis model construction and treatment process. (B-D) The pathological changes of mouse liver at 3 and 5 days with or without Gln treatment for burn sepsis (B), and changes in ALT (C) and AST (D) levels in peripheral blood of burn septic mice with or without Gln treatment. (E-K). Changes in malondialdehyde (E), myeloperoxidase (F), superoxide dismutase (G), catalase (H), mitochondrial complex I (I), mitochondrial complex II (J), and mitochondrial complex III (K) activities in liver at 3 and 5 days with or without Gln treatment for burn sepsis. (L) Changes in ATP levels in liver at 3 and 5 days with or without Gln treatment for burn sepsis. n ≥ 3 per group (Sham: n = 8, BS3: n = 4; BS5: n = 3; BS3 + G: n = 5; BS5 + G: n = 5), * P < 0.05, ** P < 0.01, Scale bar: 50 μm. Sham: sham burn group, BS (Burn Sepsis): burn sepsis group, BS + G (Burn Sepsis + Gln): burn sepsis + glutamine group.
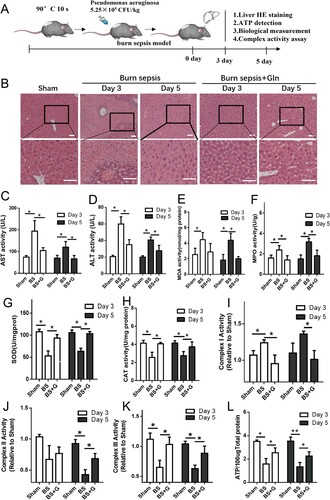
Figure 2. Gln reduces oxidative stress in hepatocytes, maintains cellular homeostasis, and promotes ATP production. (A-C) The effects of LPS alone or in combination with varying doses of Gln (2, 4, 8 mM) on the activity of mitochondrial complexes I (A), II (B), and III (C) in AML-12 cells. (D-I) The changes in ATP (D), total ROS (E-F), cell apoptosis (G, H), and mitochondrial membrane potential (I) after treatment with LPS (200 ng/mL) alone or in combination with varying doses of Gln (2, 4, 8 mM) in AML-12 cells. n = 3. Scale bar: 50 μm. * P < 0.05, ** P < 0.01.
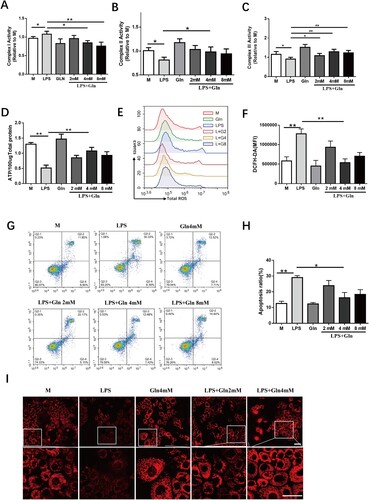
Figure 3. Glutamine maintains the activity of mitochondrial complexes for ATP production via HSP60-HSP10 dependent reduction of mitochondria protein misfolding. (A-D) AML-12 cells were treated with LPS (200 ng/mL) alone or in combination with different doses (2, 4, 8 mM) of Gln. Mitochondria were isolated and evaluated for the effect of different treatments on total mitochondrial protein misfolding using SDS-PAGE (4-15% gradient unstained) gels, after treatment with 0.1% (A, B) and 1% (C, D) Nonidet P-40. (E-F) Mitochondrial proteins were extracted from wild-type AML-12 cells treated with LPS (200 ng/mL), Gln (4 mM), and HSP60 inhibitor (15 μM, Nonactin) alone or in combination, and the separation of insoluble aggregates after treatment with 0.1% and 1% (E, F) Nonidet P-40 was evaluated using SDS-PAGE (4-15% gradient stain-free) gels to determine the effect of HSP60 inhibition on total mitochondrial protein misfolding. (G-I). Changes in mitochondrial complexes I (G), II (H), and III (I) were evaluated in AML-12 cells treated with LPS (200 ng/mL), HSP60 inhibitor (15 μM, Nonactin), or Gln (4 mM) alone or in combination. (J) Changes in ATP content were evaluated in AML-12 cells treated with LPS (200 ng/mL), HSP60 inhibitor (15 μM, Nonactin), or Gln (4 mM) alone or in combination. AU indicates arbitrary units with M or LPS + Gln normalized to 1, showing the relative changes in mitochondrial proteins after LPS treatment of AML-12 cells with different doses of Gln. n = 3. * P < 0.05, ** P < 0.01, N.S. no significance.
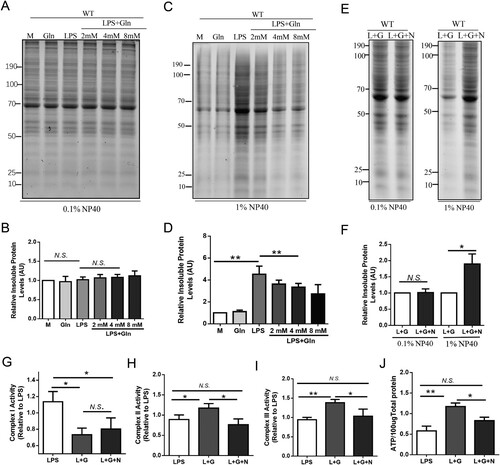
Figure 4. Glutamine reduces protein misfolding by inhibiting the acetylation of HSP60. (A-B) AML-12 cells were treated with LPS alone or in combination with different doses (2, 4, 8 mM) of Gln, and mitochondria were extracted and probed with a pan-antibody to detect changes in acetylation modification in the cells. (C-D) AML-12 cells were treated with LPS (200 ng/mL) and pan-Acetyltransferase inhibitors (Pan-ATCi) alone or in combination, and mitochondria were isolated and the insoluble aggregates were evaluated using SDS-PAGE (4-15% gradient stain-free) gels after treatment with different concentrations of Nonidet P-40 to determine the effect of different treatments on total mitochondrial protein misfolding. (E) Changes in ATP content in AML-12 cells treated with LPS alone, Gln alone, or in combination with pan-Acetyltransferase inhibitors (Pan-ATCi). (F-G) AML-12 cells were treated with LPS (200 ng/mL) alone or in combination with different doses of Gln (2, 4, 8 mM), and then the mitochondria were extracted to detect the protein expression of HSP60. After enriching the HSP60 protein using CO-IP, the acetylation modification of HSP60 was detected using an anti-acetylation antibody. AU represents arbitrary units with M or LPS + Gln normalized to 1, showing the relative changes in mitochondrial proteins after treatment of AML-12 cells with LPS in combination with Pan-ATCi. n = 3. * P < 0.05, ** P < 0.01, N.S. no significance.
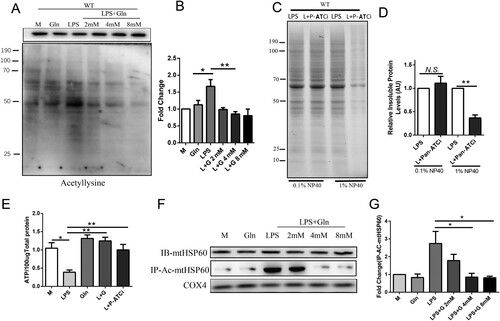
Figure 5. Gln enhances the assembly of the HSP60-HSP10 complex through deacetylation of HSP60 by SIRT4. (A-D) Mitochondrial proteins were extracted from SIRT4-KD AML-12 cells treated with LPS (200 ng/mL) and Gln (4 mM) alone or in combination, and the separation of insoluble aggregates after treatment with 0.1% (A, B) and 1% (C, D) Nonidet P-40 was evaluated using SDS-PAGE (4-15% gradient stain-free) gels to determine the effect of different treatments on total mitochondrial protein misfolding. (E-F) Mitochondrial proteins were extracted from SIRT4-KD AML-12 cells treated with LPS (200 ng/mL), Gln (4 mM), and HSP60 inhibitor (15 μM, Nonactin) alone or in combination, and the separation of insoluble aggregates after treatment with 0.1% (E) and 1% (F) Nonidet P-40 was evaluated using SDS-PAGE (4-15% gradient stain-free) gels to determine the effect of SIRT4-KD and HSP60 inhibition on total mitochondrial protein misfolding. (G-I) Changes in mitochondrial complexes I (G), II (H), and III (I) were evaluated in WT and SIRT4-KD AML-12 cells treated with LPS (200 ng/mL) or Gln (4 mM) alone or in combination. (J) Changes in ATP were evaluated in WT and SIRT4-KD AML-12 cells treated with LPS (200 ng/mL) or Gln (4 mM) alone or in combination. (K-L) AML-12 cells were treated with Gln alone or in combination with LPS, and then the interaction between SIRT4 and HSP60 was detected in vivo using CO-IP technology. M-N. AML-12 cells were treated with Gln alone or in combination with LPS, and then the interaction between HSP10 and HSP60 was detected in vivo using CO-IP technology. (O) AML-12 cells were treated with Gln (4 mM) alone or in combination with LPS (200 ng/mL), and then the co-localization of SIRT4 and HSP60 was observed using immunofluorescence technology. (P-Q) AML-12 SIRT4-KD cells were treated with LPS (200 ng/mL) alone or in combination with different doses of Gln (2, 4, 8 mM), and then the mitochondria were extracted to detect the protein expression of HSP60. After enriching the HSP60 protein using CO-IP, the acetylation modification of HSP60 was detected using an anti-acetylation antibody. (R) Using assay kits to determine the effects of SIRT4 and NAD+ on HSP60-HSP10 assembly. AU indicates arbitrary units with M or LPS + Gln normalized to 1, showing the relative changes in mitochondrial proteins after treatment of SIRT4-KD AML-12 cells with LPS alone or in combination with Gln. n = 3. Scale bar: 50 μm. * P < 0.05, ** P < 0.01, N.S. no significance.
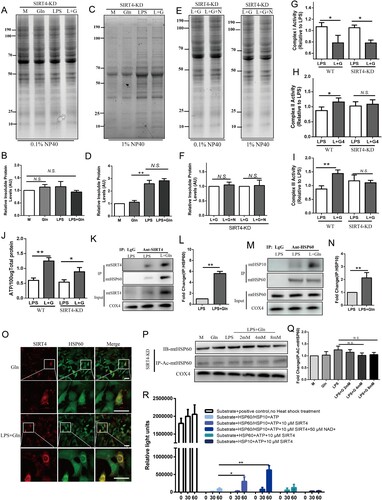
Figure 6. Gln maintains the activity of mitochondrial ETC complexed by inducing NAD+ production. (A-B) A fluorescent probe was constructed to monitor NAD+ in real-time, and the changes in NAD + were determined in AML-12 cells treated with LPS (200 ng/mL) alone or in combination with different doses of Gln (2, 4, 8 mM), as well as in AML-12 cells treated with NAD+ inhibitors (FK86, 0.2 nM), activators (AZD2461, 200 nM), and precursors (NMN, 0.5 mM). (C) Changes in NAD+/NADH were detected in AML-12 cells treated with LPS (200 ng/mL) alone or in combination with different doses of Gln (2, 4, 8 mM), as well as in hepatocytes (AML-12) treated with NAD+ inhibitors (FK86), activators (AZD2461), and precursors (NMN). (D-F) Changes in mitochondrial complexes I (D), II (E), and III (F) were evaluated in AML-12 cells treated with LPS (200 ng/mL) alone or in combination with Gln (4 mM), NAD+ inhibitors (FK86), activators (AZD2461), and precursors (NMN). (G) The changes in ATP were evaluated in AML-12 cells treated with LPS (200 ng/mL) alone or in combination with Gln (4 mM), NAD+ inhibitors (FK86), activators (AZD2461), and precursors (NMN). n = 3. Scale bar: 10 μm.* P < 0.05, ** P < 0.01, N.S. no significance.
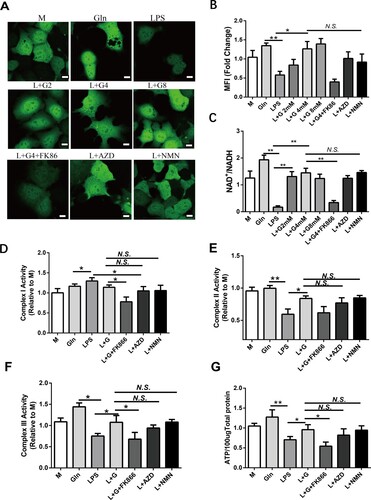
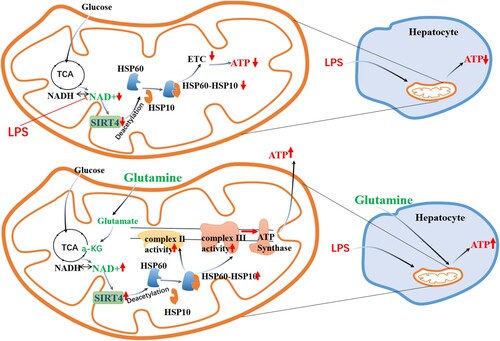
Figure 7. Gln regulates the acetylation modification of HSP60 through the NAD+/SIRT4 pathway, promoting the assembly of the HSP60-HSP10 complex to maintain the activity of mitochondrial complex, thereby regulating cellular energy metabolism.
Data availability
Data will be made available on request.