
Figures & data
Figure 1. Killing effects of JAC in cells. All cell viabilities were determined by CCK-8 assay. (A) Twelve human gastric cancer cells were treated with JAC and 5-FU (20, 40, 60, 80, and 100 μM) for 24 h. (B) Twelve human gastric cancer cells were treated with JAC and 5-FU (6, 12,18, 24, and 30 h). (C) Four human normal cells were treated with JAC and 5-FU (20, 40, 60, 80, and 100 μM) for 24 h. (D) Four human normal cells were treated with the IC50 of JAC and 5-FU (6, 12, 18, 24, and 30 h). * p < 0.05, ** p < 0.01, *** p < 0.001 vs. 5-FU group.
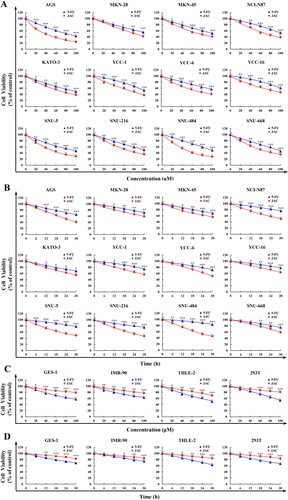
Table 1. IC50 values of JAC and 5-FU in gastric cancer cells.
Figure 2. Apoptotic effects of JAC in AGS and GES-1 cells. AGS and GES-1 cells were treated with 39 μM JAC or 5-FU for 3, 6, 12, and 24 h. (A) AGS cells were incubated with Annexin V-FITC/PI and fluorescence microscope images were determined (original magnification, 200 ×). (B) AGS cells were incubated with Annexin V-FITC/PI and analyzed by flow cytometry. (C) GES-1 cells were incubated with Annexin V-FITC/PI and analyzed by flow cytometry. (D) AGS cells were incubated with JC-1 reagent and analyzed by flow cytometry. (E) The protein expression was measured by western blotting following treatment of AGS cells with JAC. α-tubulin was used as an internal control. Data are representative of three independent experiments (n = 3), * p < 0.05, ** p < 0.01, and *** p < 0.001 vs. 0 h.
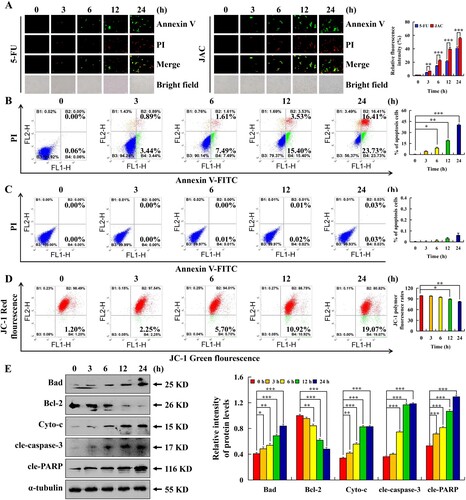
Figure 3. Network pharmacological analysis of JAC and gastric cancer. (A) Cross targets of JAC and gastric cancer drawn using Venny diagram. JAC targets are shown in blue, gastric cancer targets are shown in yellow, and cross targets are shown as a shadow. In the PPI network, nodes represent proteins, size represents the amount of gene enrichment, color represents confidence. (B) PPI network drawn using the STRING database and Cystoscope. (C) PPI Core network drawn using Cystoscope. In GO enrichment and KEGG pathway analyses, bar chart length represents the amount of gene enrichment, color represents confidence. (D) BP analysis of cross targets of JAC and gastric cancer. (E) CC of cross targets of JAC and gastric cancer. (F) MF of cross targets of JAC and gastric cancer. (G) KEGG pathway analysis of cross targets of JAC and gastric cancer.
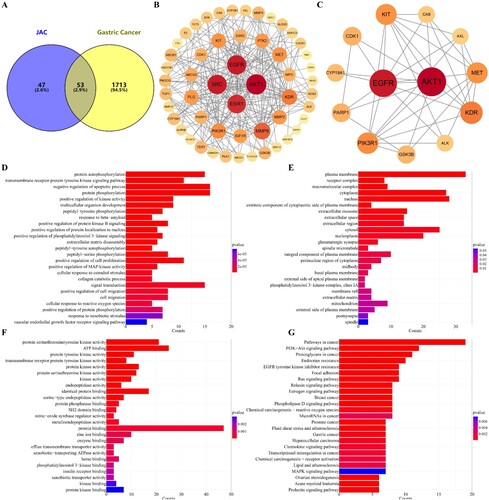
Figure 4. Effects of JAC on the MAPK/STAT3/NF-κB signaling pathway in AGS cells. AGS cells were treated with 39 μM JAC for 3, 6, 12, and 24 h. (A) Expression of MAPK, STAT3, and NF-κB signaling pathway-related proteins detected by western blotting. AGS cells treated with 39 µM JAC and 10 µM MAPK signaling pathway inhibitors for 24 h. (B) Expression of MAPK signaling pathway (ERK, JNK, and p38) proteins detected by western blotting analysis. α-tubulin was used as an internal control. Data are representative of three independent experiments (n = 3), * p < 0.05, ** p < 0.01, and *** p < 0.001 vs. 0 h, control or JAC + MAPK inhibitor groups.
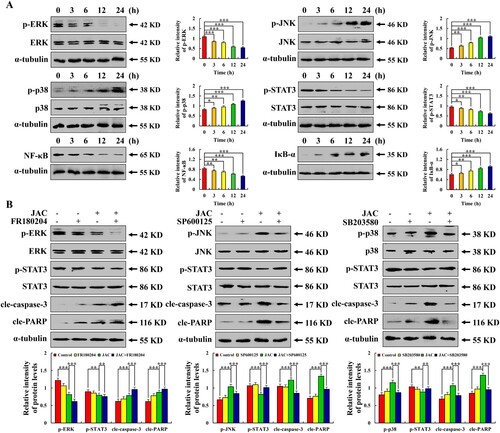
Figure 5. Effects of JAC on ROS accumulation in AGS and GES-1 cells. AGS and GES-1 cells were treated with 39 µM JAC for 3, 6, 12, and 24 h. (A) ROS accumulation in AGS cells was analyzed by DCFH-DA staining and flow cytometry. (B) ROS accumulation in GES-1 cells was analyzed by DCFH-DA staining and flow cytometry. AGS cells were treated with 39 µM JAC and 10 mM NAC for 24 h. (C) AGS cells were incubated with Annexin V-FITC/PI and flow cytometry analysis was performed to determine apoptosis. (D) Expression levels of MAPK, STAT3, NF-κB signaling pathway-related proteins, cle-caspase-3, and cle-PARP proteins detected by western blotting. α-tubulin was used as an internal control. Data are representative of three independent experiments (n = 3), * p < 0.05, ** p < 0.01, and *** p < 0.001 vs. control or JAC + NAC groups.
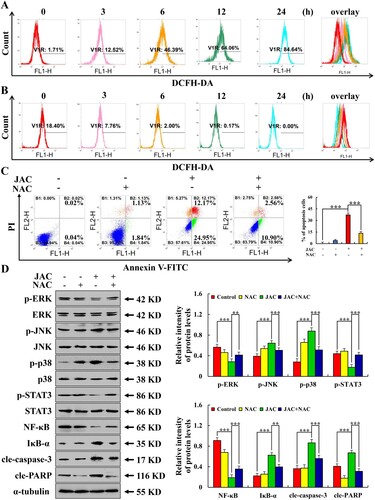
Figure 6. Effects of JAC on cell cycle. AGS cells were treated with 39 µM JAC for 3, 6, 12, and 24 h. (A) AGS cells were incubated with RNase and PI staining and analyzed by flow cytometry. (B) AGS cells treated with 39 µM JAC and/or 10 mM NAC for 24 h. AGS cells were incubated with RNase and PI staining and analyzed by flow cytometry. (C) AGS cells were treated with 39 µM JAC for 3, 6, 12, and 24 h. Expression of p-AKT, CDK2, CDK4, CDK6, Cyclin D1, Cyclin E, p21, and p27 detected by western blotting. α-tubulin was used as the internal control. (D) AGS cells treated with 39 µM JAC and/or 10 mM NAC for 24 h. Expression of p-AKT, CDK2, CDK4, CDK6, Cyclin D1, Cyclin E, and p27 detected by western blotting. α-tubulin was used as an internal control. Data are representative of three independent experiments (n = 3), * p < 0.05, ** p < 0.01, and *** p < 0.001 vs. 0 h, control or JAC + NAC groups.
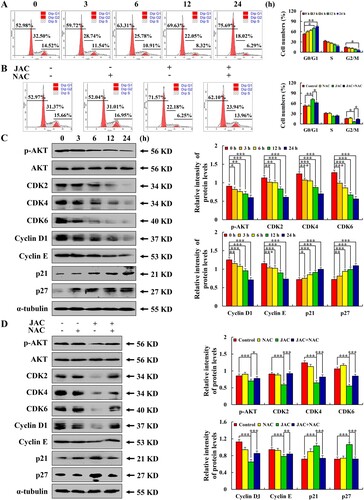
Figure 7. Effects of JAC on migration in AGS cells. AGS cells were treated with 39 µM JAC for 3, 6, 12, and 24 h, followed by fluorescence microscope (original magnification, 200 ×). (A) Transwell assay analysis of cell migration. (B) Wound-healing assay analysis of cell migration. (C) AGS cells were treated with 39 µM JAC and/or 10 mM NAC for 24 h. Wound healing assay analysis of cell migration rate. (D) AGS cells were treated with 39 µM JAC for 3, 6, 12, and 24 h. Expressions of Wnt-3a, p-GSK-3β, E-cadherin, N-cadherin, and β-catenin were determined by western blotting. (E) AGS cells were treated with 39 µM JAC and/or 10 mM NAC for 24 h. Expression of Wnt-3a, p-GSK-3β, E-cadherin, N-cadherin, and β-catenin were determined by western blotting. α-tubulin was used as an internal control. Data are representative of three independent experiments (n = 3), * p < 0.05, ** p < 0.01, and *** p < 0.001 vs. 0 h, control, or JAC + NAC groups.
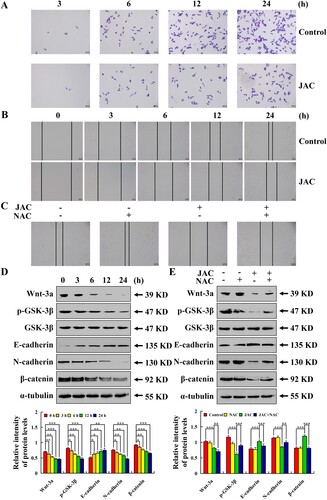
Figure 8. Schematic diagram of the anticancer role of JAC in AGS cells. JAC plays an anti-GC activity by accumulating ROS further induced mitochondria-dependent apoptosis through the MAPK/STAT3/NF-κB signaling pathway, arresting cells in the G0/G1 phase by inhibiting the AKT signaling pathway and inhibiting cell migration by inhibiting the Wnt-3a/GSK-3β/β-catenin signaling pathway.
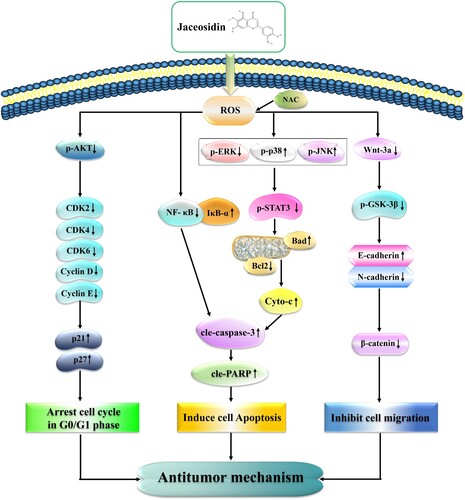
Table S1.docx
Download MS Word (16.3 KB)Original Images for Blots.zip
Download Zip (46.9 MB)Data availability statement
The data used to support the findings of this study are available from the corresponding authors upon request.