
Figures & data
Figure 1. Hyperglycemic stress induces oxidative damage of EGCs in vitro. CRL-2690 cells were treated with high glucose (200 mM) or mannitol (200 mM) for 24 h. B: Cell viability was assessed using MTT assay. C: Cell apoptosis was assessed using TUNEL assay. D: ROS generation was evaluated using DCFH-DA staining. E: MDA level of cell lysates was measured using TBA assay. F: SOD activity of cell lysates was investigated using NBT assay. ** p < 0.01 vs. CT. CT: control (5.6 mM), HG: high glucose (200 mM), MT: mannitol (200 mM).
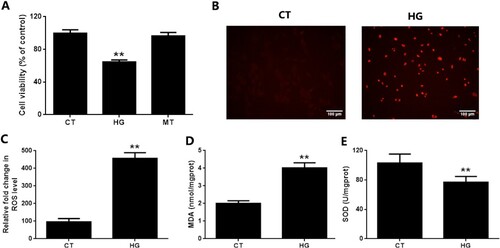
Figure 2. Hyperglycemic stress induces oxidative damage in EGCs in vivo. A: Fast blood glucose (FBG), food consumption and drinking water (distilled water) per 24 h were measured in CT and DM mice. B: Cell apoptosis of EGCs in the duodenum of CT and DM mice was analyzed using immunofluorescence analysis (TUNEL: red fluorescence, GFAP: green fluorescence, DAPI: blue fluorescence). C&D: The samples of duodenum tissues were collected from CT and DM mice. MDA level of tissues was assessed using TBA assay and SOD activity of tissues was studied using NBT assay. ** p < 0.01 vs. CT. CT: control (<100 mg/dL); STZ: DM (>300 mg/dL) (6 weeks post STZ-injection).
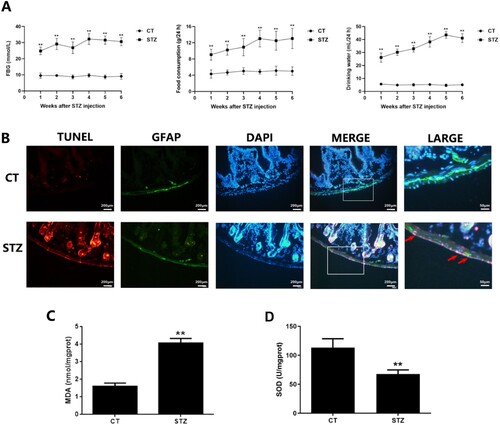
Figure 3. Hyperglycemic stress induces redoxosomes activation in EGCs in vitro and in vivo. A&B: CRL-2690 cells were treated with high glucose (200 mM) for 6 h or 12 h. The expressions of redoxosomes-related proteins were assessed using western blot analysis. NOX activity was evaluated using DCPIP assay. CT: control (5.6 mM), HG: high glucose (200 mM). C: The samples of duodenum tissues were collected from CT and DM mice. The expressions of NOX4 in EGCs were assessed using immunofluorescence analysis (NOX4: red fluorescence, GFAP: green fluorescence, DAPI: blue fluorescence). ** p < 0.01 vs. CT. CT: control (<100 mg/dL); STZ: DM (>300 mg/dL) (6 weeks post STZ-injection).
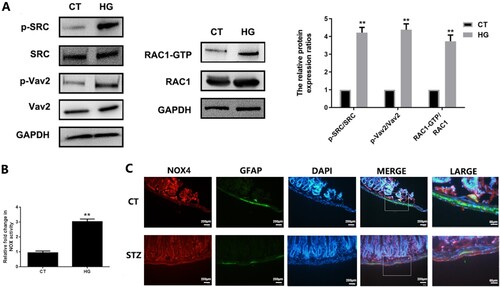
Figure 4. The in vitro redoxosomes deactivation attenuates EGCs oxidative damage under hyperglycemic stress. CRL-2690 cells were pre-treated with RAC1 inhibitor (NSC23766, 80 μM, 6 h) or NOX inhibitor (VAS2870, 10 μM, 6 h) for 12 h, and then treated with high glucose (200 mM) for another 24 h. A: Cell viability was assessed using MTT assay. B: Cell apoptosis was evaluated using TUNEL assay. C: ROS generation was investigated using DCFH-DA staining. D: MDA level of cell lysates was assessed using TBA assay. E: SOD activity of cell lysates was measured using NBT assay. ** p < 0.01 vs. HG. CT: control (5.6 mM), HG: high glucose (200 mM).
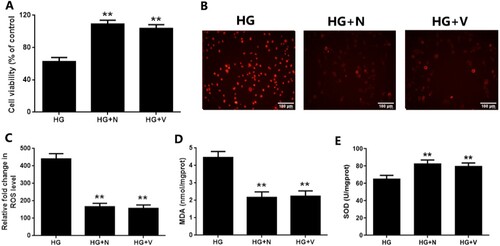
Figure 5. The in vivo redoxosomes deactivation ameliorates EGCs oxidative damage in hyperglycemic stress. Diabetic mice (2 weeks post STZ-injection) were intestinal intramuscular injected with NSC23766 (150 μM/every 3 d/4 weeks) or VAS2870 (50 μM/every 3 d/4 weeks). The apoptosis of EGCs in duodenum of DM mice was analyzed using immunofluorescence analysis (TUNEL: red fluorescence, GFAP: green fluorescence, DAPI: blue fluorescence). B&C: The samples of duodenum tissues were collected from CT and DM mice. MDA level of tissues was assessed using TBA assay and SOD activity of tissues was evaluated using NBT assay. ** p < 0.01 vs. CT. CT: control (<100 mg/dL); STZ: DM (>300 mg/dL) (6 weeks post STZ-injection).
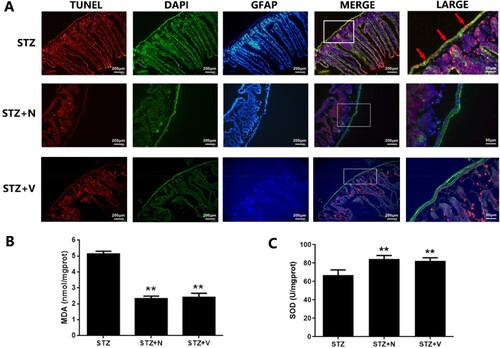
Figure 6. Hyperglycemic stress induces p66SHC activation in EGCs in vitro and in vivo. A: CRL-2690 cells were pre-treated with RAC1 inhibitor (NSC23766, 80 μM, 6 h) or NOX inhibitor (VAS2870, 10 μM, 6 h) for 12 h, and then treated with high glucose (200 mM) for another 12 h. The protein expression and distribution of p-p66SHC and p66SHC were evaluated using western blot analysis. CT: control (5.6 mM), HG: high glucose (200 mM). B: Diabetic mice (2 weeks post STZ-injection) were intramuscularly injected with NSC23766 (150 μM/every 3 d/4 weeks) or VAS2870 (50 μM/every 3 d/4 weeks). The expression of p-p66SHC in EGCs were assessed using immunofluorescence analysis (p-p66SHC: red fluorescence, GFAP: green fluorescence, DAPI: blue fluorescence). ** p < 0.01 vs. CT. ## p < 0.01 vs. HG. CT: control (<100 mg/dL); STZ: DM (>300 mg/dL) (6 weeks post STZ-injection).
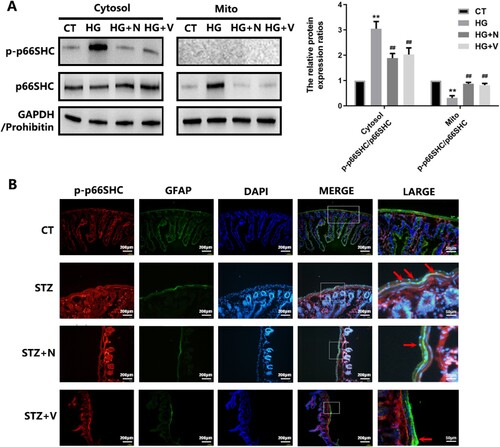
Figure 7. The in vitro p66SHC knockdown ameliorates oxidative damage of EGCs under hyperglycemic stress. CRL-2690 cells with p66SHC knockdown were treated with high glucose (200 mM) for 24 h. A: Cell viability was assessed using MTT assay. B: Cell apoptosis was evaluated using TUNEL assay. C: ROS generation was investigated using DCFH-DA staining. D: MDA level of cell lysates was assessed using TBA assay. E: SOD activity of cell lysates was studied using NBT assay. ** p < 0.01 vs. CT, ## p < 0.01 vs. HG. CT: control; HG: high glucose; KD: knockdown.
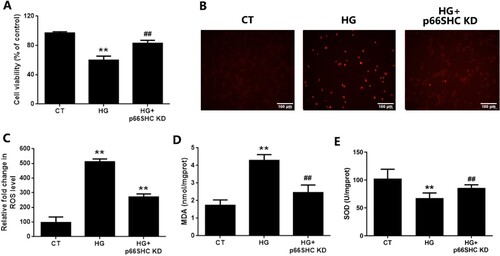
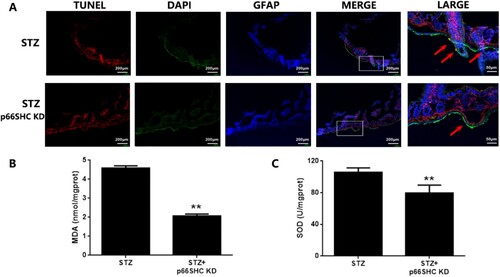
Figure 8. The in vivo p66SHC knockdown ameliorates oxidative damage in EGCs under hyperglycemic stress. Mice were intestinal-intramuscular injected with AAV-9-p66SHC shRNA for 7 days and then injected with STZ for 5 days. A: Cell apoptosis of EGCs in the duodenum of DM mice was analyzed using immunofluorescence analysis (TUNEL: red fluorescence, GFAP: green fluorescence, DAPI: blue fluorescence). B&C: The samples of duodenum tissues were collected from CT and DM mice. MDA level of tissues was assessed using TBA assay and SOD activity of tissues was assessed using NBT assay. ** p < 0.01 vs. DM. CT: control; STZ: DM (6 weeks post STZ-injection).
Data availability statement
The authors confirm that the datasets used and analyzed during the current study are available from the corresponding author on reasonable request.