
Figures & data

Figure 1. ATX significantly inhibited the reduction of BMD and BMC in PA-treated OVX rats by Micro-CT. *vs Sham group (P < 0.05); #vs OVX group (P < 0.05); &vs OVX + PA group (P < 0.05).
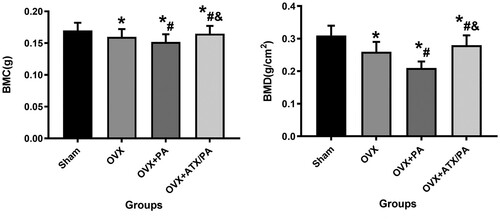
Figure 2. Micro-CT 2D and 3D images and evaluation of the microscopic parameters of the trabeculae of treated OVX rats. Micro-CT 2D and 3D images of rats belonging to Sham (A, a), OVX (B, b), OVX + PA (C, c), and OVX + ATX/PA (D, d) groups (scale bar = 1 mm). E. The trabecular parameters of the distal femur include BV/TV, Tb.N, Tb.Sp, Tb.Th, Conn.D, and BMD. *vs Sham group (P < 0.05); #vs OVX group (P < 0.05); &vs OVX + PA group (P < 0.05).
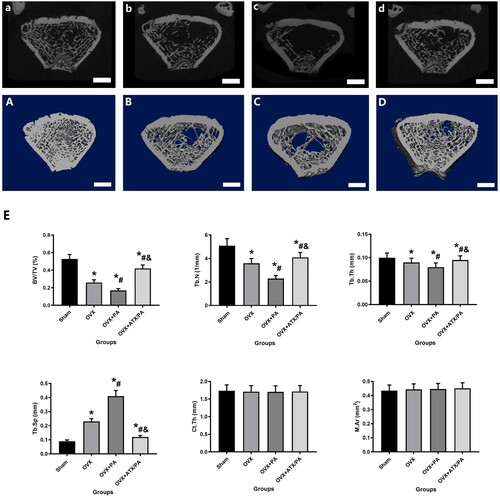
Figure 3. Treatment with ATX prevented bone loss and increased mineral apposition rate in OVX rats treated with PA. (A) Representative images of HE staining and Masson’s staining of the metaphyseal tissue of the distal femur (Magnification, ×20) and mineral apposition rate (Magnification, ×200). (B) Quantitative analysis of MAR. *vs Sham group (P < 0.05); #vs OVX group (P < 0.05); &vs OVX + PA group (P < 0.05).
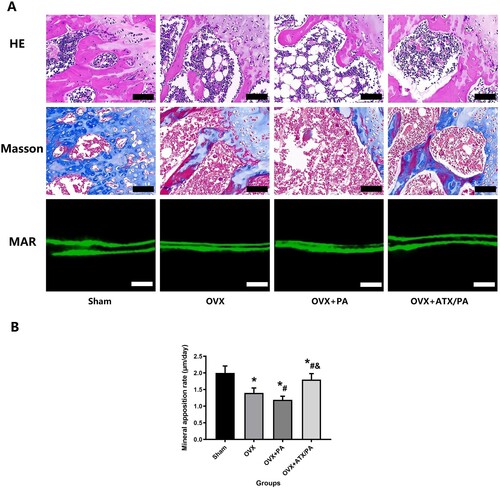
Figure 4. Systemic administration of ATX modulates osteoblast and osteoclast activity in OVX rats treated with PA. (A) Representative images were analyzed by immunohistochemistry for OC and TRAP. (B) Quantitative analysis of OC and TRAP (magnification, ×63). *vs Sham group (P < 0.05); #vs OVX group (P < 0.05); &vs OVX + PA group (P < 0.05).
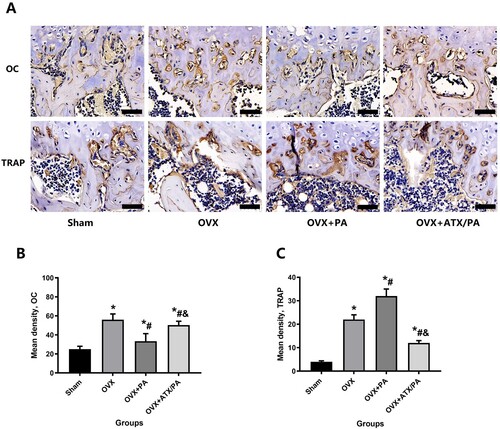
Figure 5. Systemic administration of ATX modulates levels of specific indicators, including bone metabolism and oxidative stress, in OVX rats treated with PA. Serum levels of ALP (A) and OC (C) were evaluated as markers of bone formation. Serum levels of the bone resorption markers TRAP-5b (B) and CTX (D). Levels of the oxidative stress markers SOD (E) and MDA (F). *vs Sham group (P < 0.05); #vs OVX group (P < 0.05); &vs OVX + PA group (P < 0.05).
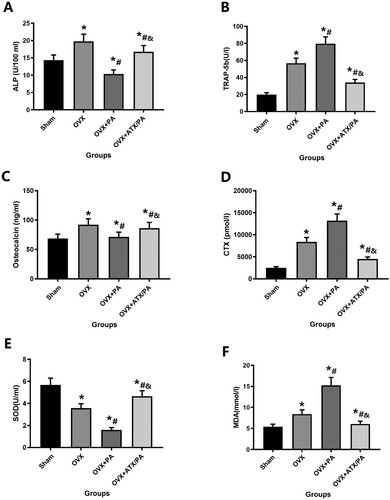
Figure 6. ATX increase the expression of SIRT1 and SDO2 in OVX rats treated with PA. (A) Representative images of the expression of SIRT1 in the metaphyseal tissue of the distal femur (scale bar = 25 µm). (B) Quantitative analysis of the expression of SIRT1 and SDO2. *vs Sham group (P < 0.05); #vs OVX group (P < 0.05); &vs OVX + PA group (P < 0.05).
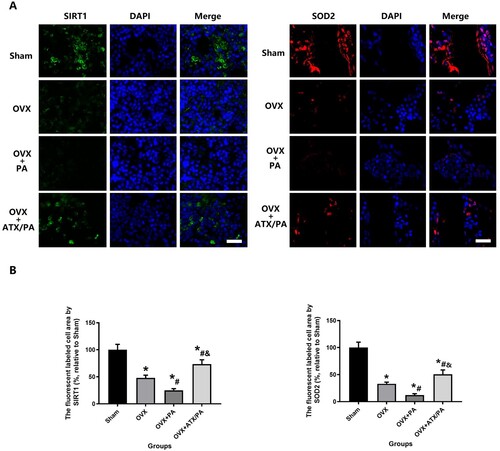
Figure 7. Effect of ATX on the proliferation rate of MC3T3-E1 cells treated with PA. (A) The effect of PA on cell proliferation rate at different concentrations was detected by CCK-8 for 24 h; **vs Con group (P < 0.01). (B–D) The effect of ATX on the rate of cell proliferation was detected by CCK-8 at a concentration of 20 uM PA for 6, 12 and 24 h. *vs Control group (P < 0.05); #vs PA group (P < 0.05); &vs ATX + PA group (P < 0.05).
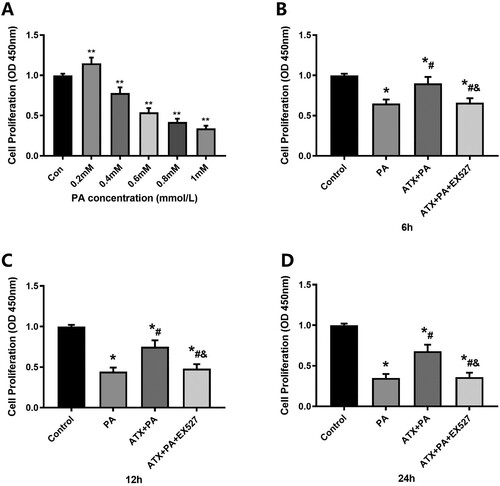
Figure 8. Effect of ATX intervention on MC3T3-E1 osteogenesis by alkaline phosphatase staining and calcified nodule formation by alizarin red staining with PA treatment. (A) After the addition of ATX, the expression of alkaline phosphatase and the formation of calcified nodules increased significantly (scale bar = 50 µm). (B) Quantitative analysis of positive areas of alkaline phosphatase staining and positive areas of alizarin staining. *vs Control group (P < 0.05); #vs PA group (P < 0.05); &vs ATX + PA group (P < 0.05).
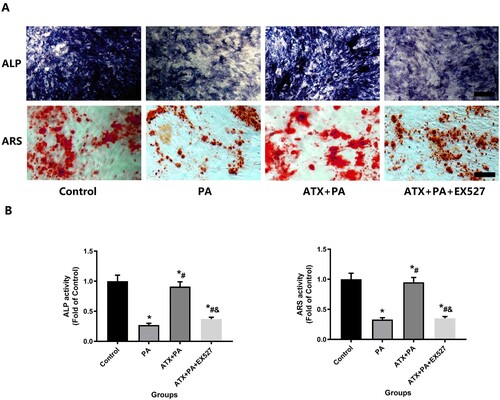
Figure 9. ATX treatment can reduce the elevated levels of MC3T3-E1 oxidative stress caused by PA intervention. (A) ATX treatment can reduce the elevated levels of MC3T3-E1 ROS and Mito SOX caused by PA intervention(scale bar = 25 µm); (B,C) quantitative analysis of positive fluorescence intensity of ROS and Mito SOX staining MC3T3-E1; (D, E) SOD and MDA levels were significantly changed after ATX and PA intervention. * vs Control group (P < 0.05); #vs PA group (P < 0.05); &vs ATX + PA group (P < 0.05).
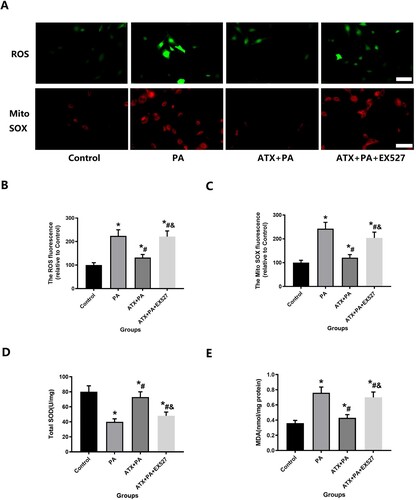
Figure 10. ATX intervention increased MC3TE-E1 resistance to oxidative stress and was analyzed by SIRT1 and SOD2 expression. (A) SIRT1 and SOD2 were observed at high magnification to assess the ability of ATX to significantly improve the resist oxidative stress caused by PA intervention in MC3TE-E1 (Scale bar = 25 µm); (B) quantitative analysis of changes in SIRT1 and SOD2 expression in MC3TE-E1 after ATX and PA interventions. *vs Control group (P < 0.05); #vs PA group (P < 0.05); &vs ATX + PA group (P < 0.05).
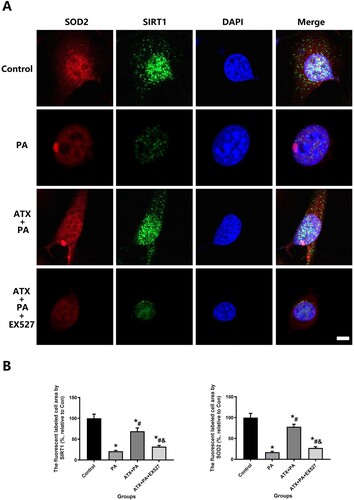
Figure 11. ATX intervention promotes recovery of mitochondrial membrane potential activity in the presence of PA by JC-1 staining. (A) JC-1 stainings were observed at high magnification to assess the ability of ATX to significantly improve the recovery of mitochondrial membrane potential in PA-treated MC3TE-E1 (scale bar = 25 µm); (B) quantitative analysis of changes in mitochondrial membrane potential in MC3TE-E1 treated with PA after ATX intervention. *vs Control group (P < 0.05); #vs PA group (P < 0.05); &vs ATX + PA group (P < 0.05).
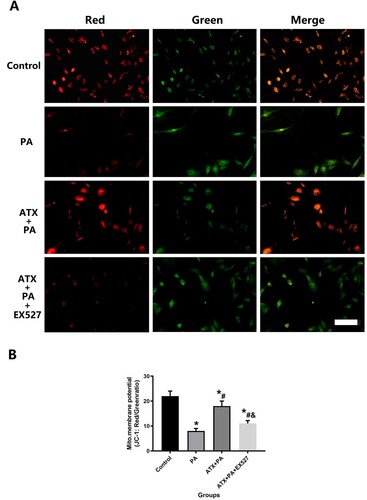
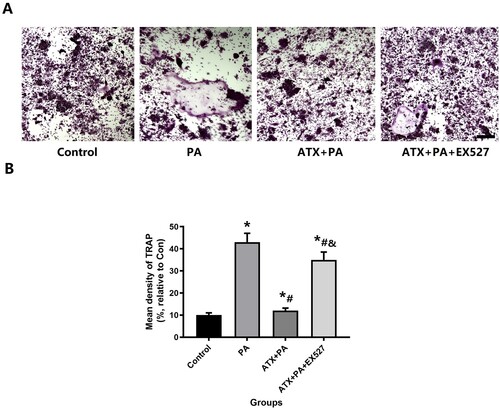
Figure 12. The increased osteoclast capacity in RAW264.7 cell treated by PA was disturbed by ATX treatment. (A) After adding ATX, the higher expression of TRAP decreased significantly by PA (scale bar = 50 µm); (B) for the quantitative analysis of TRAP staining positive areas. *vs Control group (P < 0.05); #vs PA group (P < 0.05); &vs ATX + PA group (P < 0.05).
Graphical Abstract.docx
Download MS Word (50 KB)Data availability statement
The data that support the findings of this study are available from the corresponding author [ZS Tao], upon reasonable request.