Figures & data

Figure 1. MTHFD2 is highly expressed and predicts poor prognosis in GC. (A) Schematic representation of the function of MTHFD1/2 in folate metabolism. (B) Quantitative polymerase chain reaction (qPCR) analysis of MTHFD1/2 expression in 36 paired GC tissues. (C–D) MTHFD2 expression profiling in multiple GC microarray datasets from the Oncomine (C) and TCGA (D) databases. (E) Immunohistochemical analyses of 96 human GC specimens and their paired adjacent normal gastric tissues were performed. MTHFD2 in tumor tissues is higher than in adjacent tissues. Representative staining images are shown (scale bar = 100 μm). (F) Immunohistochemical staining scores of MTHFD2 in paired primary GC tumor and paired normal tissues. (G-H) Kaplan–Meier analysis of 5-year survival (G), overall survival and disease-free survival (H) for GC patients with low vs. high MTHFD2 expression. MTHFD1/2 = methylene tetrahydrofolate dehydrogenase 1/2; N = normal tissues; ANT = adjacent normal tissues; T = tumor. Data are presented as mean ± SD, Student’s t test (non-parametric comparisons for B and D, parametric comparison for C and F) or log-rank test (G-H). ns, not significant, **P < 0.01.
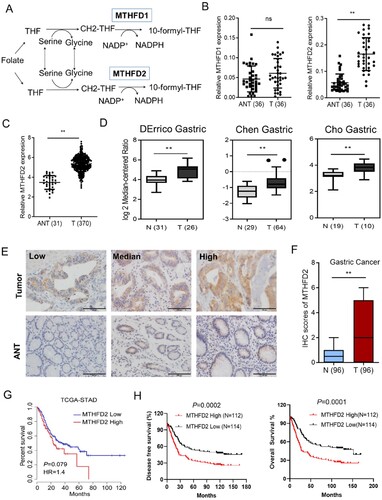
Figure 2. MTHFD2 suppression inhibits GC cell proliferation. (A–B) qPCR and immunoblotting analysis of MTHFD2 expression levels in gastric cancer cell lines. (C) Immunoblotting analysis of MTHFD2 protein levels in paired GC and normal tissues. (D) Immunoblotting evaluating the knockdown efficiency of MTHFD2 with two unique shRNAs (#1, #2) in HGC27 and MKN74 cells. (E) Proliferation of sh-Control and sh-MTHFD2 MKN74 and HGC27 cells. (F-G) Colony formation assays in MKN74 and HGC27 cells after knockdown of MTHFD2. β-Actin was included as a loading control. Data are presented as mean ± SD, one-way ANOVA (non-parametric comparisons for A and G) or two-way ANOVA (E). ns, not significant, **P < 0.01.
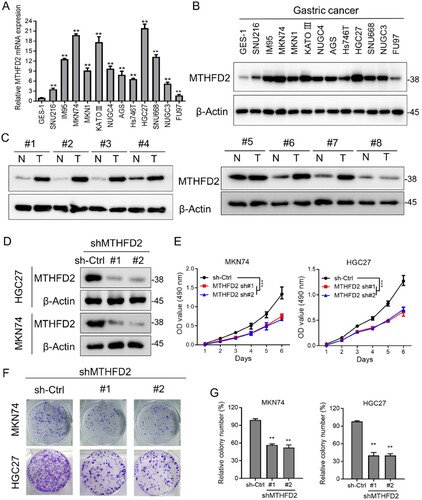
Figure 3. MTHFD2 knockdown impairs NADPH homeostasis and accelerates GC cell death under hypoxia. (A) Gene set enrichment score and distribution of ROS-related genes along the rank of MTHFD2 up vs. MTHFD2 down available from The Cancer Genome Atlas GC database. (B–D) Cellular ROS (B), NADPH/NADP+ (C) and GSH/GSSG (D) levels were measured in indicated GC cells under hypoxic conditions for 24 h. (E) Cell death was measured by Annexin-V/PI assays in the indicated GC cells under normal and hypoxic conditions for 48 h (red numbers indicate the subpopulation of cells positive for Annexin V/PI). (F) Quantification of cell death in the indicated cells cultured under hypoxic conditions for 72 h (with or without 5 mM N-acetyl-L-cysteine). (G) Immunoblotting analysis of cleaved poly ADP-ribose polymerase (PARP) in the indicated GC cells. GAPDH was included as a loading control. Nor = normoxia. Data are presented as mean ± SD, one-way ANOVA (non-parametric comparisons). ns, not significant, **P < 0.01.
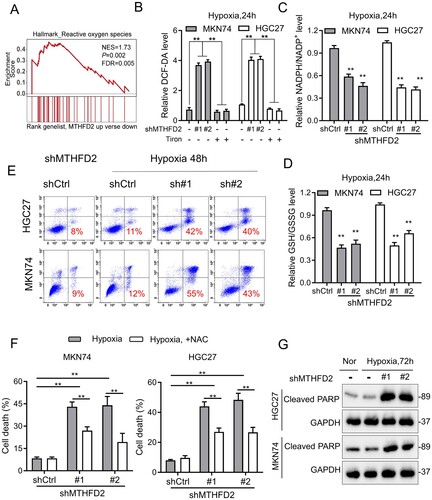
Figure 4. MTHFD2 knockdown suppresses GC tumorigenesis in vivo. (A–C) A xenograft model was established in nude mice subcutaneously implanted with MTHFD2-knockdown and control MKN74 cells (N = 5). Tumor images are presented (A). Tumor volumes were calculated (B) Tumor weights were obtained (C). (D–F) Patient-derived xenograft (PDX) tumors were implanted into the flanks of mice. Mice were treated with either PBS or si-MTHFD2. Tumor images are shown (D). Tumor volumes were calculated (E). Tumor weights were obtained (F). (G) Paraffin-embedded tumor sections derived from the indicated group were stained with hematoxylin and eosin (HE) or MTHFD2, Ki67 and cleaved caspase 3 antibodies or TUNEL assay. Ki67 levels are lower, whereas cleaved caspase 3 and TUNEL levels are higher, in tumor tissues with MTHFD2 knockdown. Representative staining images are shown (scale bar = 100 μm). H. The proliferation index (Ki67 staining), apoptotic index (cleaved caspase 3) and TUNEL index in tumor sections were quantified. Data are presented as mean ± SD, one-way ANOVA (parametric comparisons, C and F), Student’s t test (non-parametric comparison, H) or two-way ANOVA (B and E). ns, not significant, **P < 0.01.
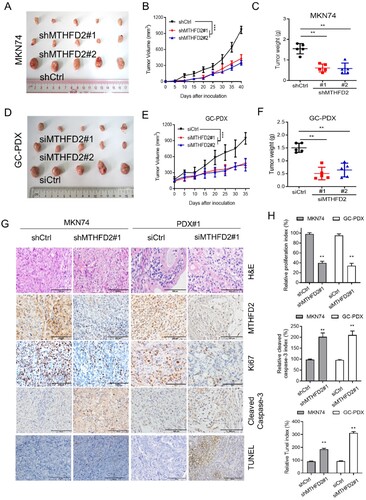
Figure 5. DS18561882 reduces NADPH production and GC cell growth in vitro. (A) Chemical structure of DS18561882. (B) The viability of the indicated GC cells treated with DS18561882 for 72 h was determined by MTS assay. (C–D) Colony formation assays in MKN74 and HGC27 cells treated with DS18561882. (E-G) Cellular NADPH/NADP+ (E), GSH/GSSG (F) and ROS (G) levels were measured in the indicated GC cells treated with DS18561882 under conditions of hypoxia for 24 h. (H–I) Cell death was measured using Annexin-V/PI assays in the indicated GC cells treated with DS18561882 under normal or hypoxic conditions for 48 h (red numbers indicate the subpopulation of cells positive for Annexin V/PI). Data are presented as mean ± SD, one-way ANOVA (non-parametric comparisons). ns, not significant, **P < 0.01.
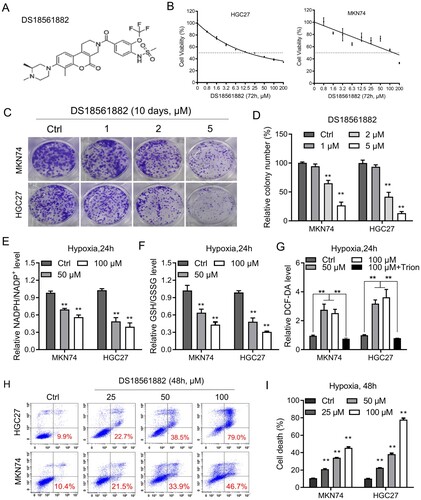
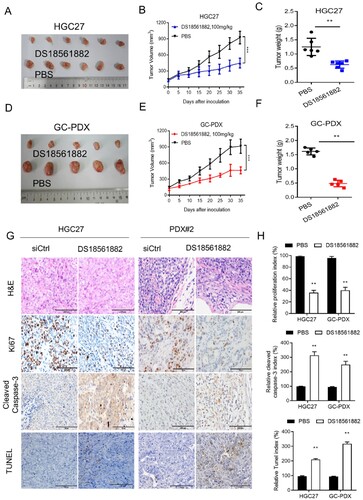
Figure 6. DS18561882 exerts antitumor effects against GC in vivo. (A–C) A xenograft model was established in nude mice subcutaneously implanted with MTHFD2-knockdown and control HGC27 cells (N = 6). Tumor images are shown (A). Tumor volumes were calculated (B). Tumor weights were obtained (C). (D–F) Patient-derived xenograft (PDX) tumors were implanted into the flanks of mice. Mice were treated either with PBS or DS18561882. Tumor images are shown (D). Tumor volumes were calculated (E). Tumor weights were obtained (F). (G) Paraffin-embedded tumor sections derived from the indicated group were stained with hematoxylin and eosin (HE) or MTHFD2, Ki67, and cleaved caspase 3 antibodies or TUNEL assay. Ki67 levels are lower, whereas cleaved caspase 3 levels are higher, in tumor tissues with MTHFD2 inhibition. Representative staining images are shown (scale bar = 100 μm). H. The proliferation index (Ki67 staining), apoptotic index (cleaved caspase 3) and TUNEL index in tumor sections were quantified. Data are presented as mean ± SD, Student’s t test (parametric comparisons for C and F, non-parametric comparison for H) or two-way ANOVA (B and E). ns, not significant, **P < 0.01.