
Figures & data
Table 1. Primer sequences used for gene amplification in A549 cells.
Figure 1. TOM5 expression was elevated and associated with fibrosis in lung tissues of OP patients. (A) HE and Masson staining of lung tissue sections. Black arrow indicated inflammatory cell infiltration stained by HE. Black star indicated the mature collagen stained by Masson. Scale bars = 100 μm; (B) Representative immunohistochemical analysis of TOM5. Scale bars = 100 μm; (C) Correlation analysis between TOM5 DOI/area and the proportion of inflammatory area; Correlation analysis between TOM5 DOI/area and collagen area fraction. All experiments were repeated at least three times. * P < 0.05, ** P < 0.01, *** P < 0.001.
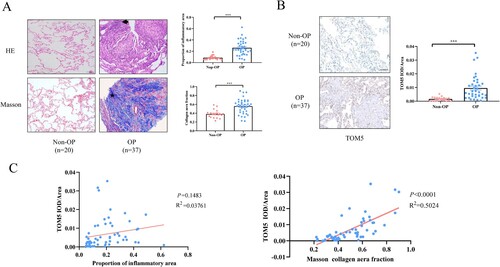
Table 2. Clinical characteristics
Figure 2. Elevated expression of TOM5 in a chronic model of OP. (A) Establishment of a murine model of OP; (B) Survival curves and body weight changes; (C) HE and Masson staining of lung tissue sections. Black arrow indicated inflammatory cell infiltration stained by HE. Black star indicated the mature collagen stained by Masson. Scale bars = 100 μm; (D) Representative immunohistochemical analysis of TOM5. Scale bars = 100 μm; (E) TOM5 expression in murine pulmonary tissues. All experiments were repeated at least three times. * P < 0.05, ** P < 0.01, *** P < 0.001.
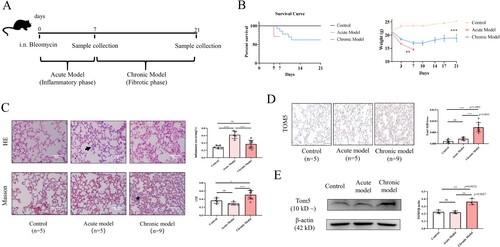
Figure 3. High-concentration H2O2 decreased TOM5 in alveolar epithelial cells. (A) CCK8 assay and LDH release assay were used to detect the viability of A549 cells after treatment with different concentrations of H2O2, and 250 μM H2O2 was chosen to build a cell apoptosis model. (B) The expression level of TOM5 in A549 cells was detected by immunofluorescence. Scale bars = 100 μm; (C) The mRNA expression level of TOM5 in A549 cells detected by qPCR; (D) The protein expression level of TOM5 in A549 cells detected by Western blot. (E) LC3B II, LC3B I and ATG4B protein expression in A549 cells stimulated with 250 μM H2O2 for 0, 2, 4 and 8 hours; (F) The optimal intervention concentration of autophinib was detected by Western blot. LC3B II, LC3B I and ATG4B protein expression in A549 cells stimulated with 250 μM H2O2 in the presence or absence of the autophagy inhibitor autophinib; (G) TOM5 protein expression in A549 cells stimulated with 250 μM H2O2 for 8 hours in the presence or absence of autophinib. All experiments were repeated at least three times. * P < 0.05, ** P < 0.01, *** P < 0.001.
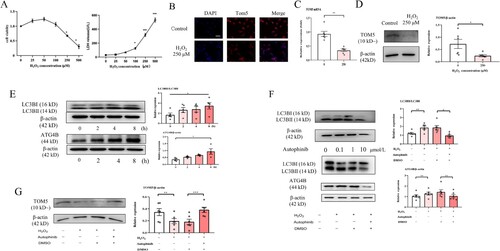
Figure 4. Low-concentration H2O2 increased TOM5 in alveolar epithelial cells via the MAPK/p38 and PI3 K/Akt pathways. (A) CCK8 assay and LDH release assay were used to detect the cell viability of A549 cells after intervention with different concentrations of H2O2, and 10 μM H2O2 was chosen to build the cell proliferation model. (B) The mRNA expression level of TOM5 in A549 cells detected by qPCR. (C) The protein expression level of TOM5 in A549 cells detected by Western blot. (D) P-p38, p38, p-Akt and Akt protein expression in A549 cells stimulated with 10 μM H2O2 for 0, 0.25, 0.5, 1, 2 and 4 hours; (E) P-p38, p38 and TOM5 protein expression in A549 cells stimulated with 10 μM H2O2 for 0.25 hours in the presence or absence of the p38 inhibitor. (F) P-Akt, Akt and TOM5 protein expression in A549 cells stimulated with 10 μM H2O2 for 0.25 hours in the presence or absence of the PI3 K/Akt inhibitor. All experiments were repeated at least three times. * P < 0.05, ** P < 0.01, *** P < 0.001.
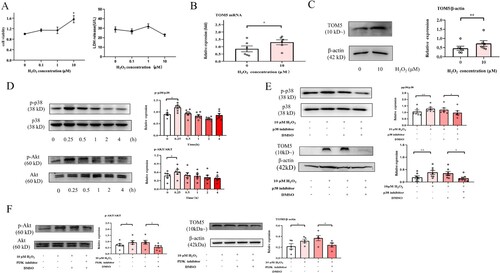
Figure 5. Effect of TOM5 expression on mitochondrial membrane potential. (A) The effect of transfection with the TOM5-overexpressing plasmid and CRISPR/Cas9 plasmid was determined in A549 cells by immunofluorescence and Western blot assays. Scale bars = 100 μm; (B) Mitochondrial membrane potential was assessed using JC-1 in A549 cells. Scale bars = 100 μm; (C) Mitochondrial membrane potential was determined using TMRM in A549 cells. Scale bars = 100 μm. All experiments were repeated at least three times. * P < 0.05, ** P < 0.01, *** P < 0.001.
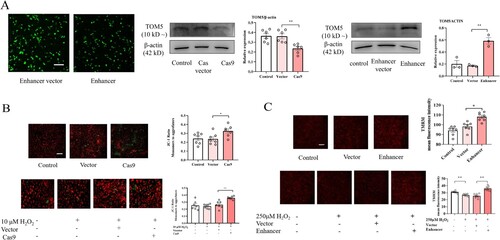
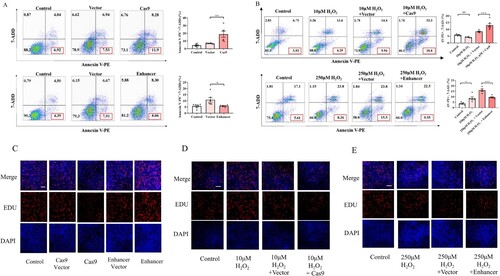
Figure 6. Effect of TOM5 expression on cell apoptosis and proliferation. (A) and (B) Flow cytometry analysis was used to calculate the early apoptosis rate in A549 cells. All experiments were repeated at least three times. (C)-(E) Cell proliferation tested by EdU assay in A549 cells. Nuclei (blue) were labeled with Hoechst 33342. Cells were visualized and photographed with an inverted fluorescence microscope. * P < 0.05, ** P < 0.01, *** P < 0.001.
Data availability statement
The data presented in this study are available upon request from the corresponding author.