
Figures & data
Figure 1. Diabetes results in permanent hearing loss and leakage of cochlear stria vascularis in C57BL/6J mice. A-D: Representative images of ABR waveforms in each group of mice (Control, DM4w, DM8w, DM12w); E: Representative images of Evans blue staining in each group of mice (Scale bar = 50 μm) and zoomed-in images (Scale bar = 25 μm); F: Statistical figure of ABR wave I hearing threshold of mice in each group and Latency statistics of ABR I wave, n = 10 mice per group, One-way Anova with Turkey’s post-hoc test, *P < 0.05, **P < 0.01,***P < 0.001 vs Control, #P < 0.05 vs DM4w group, &P < 0.05 vs DM8w group; G: Leakage fluorescence density statistical diagram of each group, n = 5 mice per group, One-way Anova with Turkey’s post-hoc test, *P < 0.05, **P < 0.01,***P < 0.001 vs Control, #P < 0.05 vs DM4w group, &P < 0.05 vs DM8w group. Data are presented as the means ± SEMs.
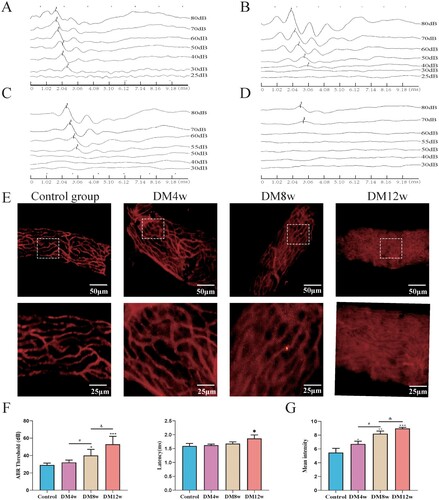
Figure 2. Diabetes elevates oxidative stress levels in mice's organs and exacerbates over time. A: Quantitative analysis of SOD expression levels in the liver, brain, serum, and cochlea of each group of mice, n = 5 mice per group, One-way Anova with Turkey’s post-hoc test, *P < 0.05, **P < 0.01 vs Control, #P < 0.05, ##P < 0.01 vs DM4w group, &P < 0.05, &&P < 0.01 vs DM8w group; B: Quantitative analysis of MDA expression levels in the liver, brain, serum, and cochlea of each group of mice, n = 5 mice per group, One-way Anova with Turkey’s post-hoc test, *P < 0.05, ***P < 0.001 vs Control, #P < 0.05,##P < 0.01 vs DM4w group, &P < 0.05,&&P < 0.01 and &&&P < 0.001vs DM8w group. Data are presented as the means ± SEMs.
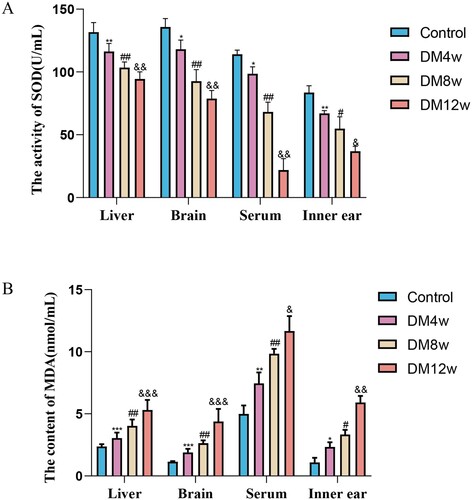
Figure 3. Diabetes induced cochlear stria vascularis injury and increased pericytes apoptosis in C57BL/6J mice. A: HE staining of cochlear stria vascularis in each group, Scale bar = 50 μm; B: B: Representative images of immunohistochemistry for Bax and Caspase-3 in the cochlear stria vascularis of each group, Scale bar = 50 μm; C: Statistical results of Bax expression levels in the cochlear stria vascularis, n = 5 mice per group, One-way Anova with Turkey’s post-hoc test, *P < 0.05, **P < 0.01 vs Control, #P < 0.05 vs DM4w group, &P < 0.05 vs DM8w group; D: Statistical results of Caspase-3 expression levels in the cochlear stria vascularis, n = 5 mice per group, One-way Anova with Turkey’s post-hoc test, *P < 0.05, **P < 0.01 vs Control, #P < 0.05 vs DM4w group, &P < 0.05 vs DM8w group; E: Representative images of co-labeling of PDGFR-β, Bax, and Caspase-3 in the cochlear stria vascularis pericytes, Scale bar = 50 μm; F: Statistical results of Bax expression levels in the cochlear stria vascularis pericytes, n = 5 mice per group, One-way Anova with Turkey’s post-hoc test, *P < 0.05, **P < 0.01, ***P < 0.01 vs Control, #P < 0.05 vs DM4w group, &P < 0.05 vs DM8w group; G:Statistical results of Caspase3 expression levels in the cochlear stria vascularis pericytes, n = 5 mice per group, One-way Anova with Turkey’s post-hoc test, *P < 0.05, **P < 0.01,***P < 0.001 vs Control, #P < 0.05 vs DM4w group, &P < 0.05 vs DM8w group. Data are presented as the means ± SEMs.
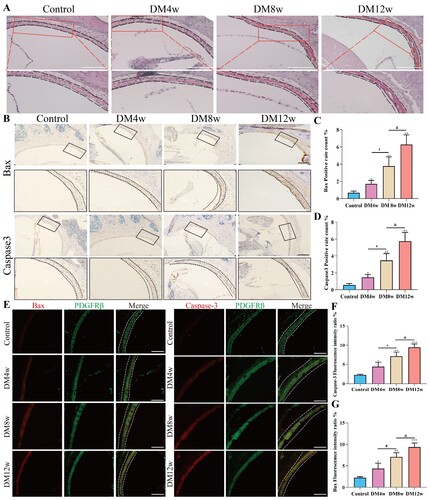
Figure 4. Successful primary culture of cochlear stria vascularis pericytes and optimal high glucose intervention concentration. A: Dissected cochlear stria vascularis; B: Representative image of stria vascularis pericytes on the third day of culture, Scale bar = 50 μm; C: Representative image of cochlear pericytes on the fourteenth day of culture, Scale bar = 100 μm; D: Identification of stria vascularis pericytes, Scale bar = 50 μm; E: Statistical results of the CCK8 assay for screening the appropriate high glucose intervention concentration, n = 6, One-way Anova with Turkey’s post-hoc test, ***P < 0.001 vs Control; F:The effect of glucose on the survival rate of stria vascularis pericytes and the EC50 of glucose for these cells.
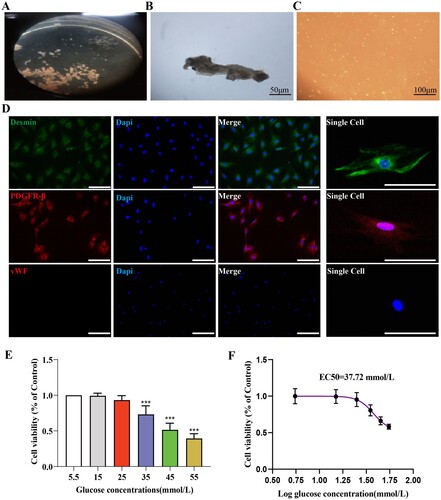
Figure 5. The apoptosis level of pericytes increases in a high-glucose environment. A: FITC-PI flow cytometry representative images; B: Hoechst33342 staining representative images (Hoechest 33342 deep stained cells have been marked with arrows), Scale bar = 50 μm; C: Statistical results of percentage of apoptotic cells by flow cytometry, n = 3, One-way Anova with Turkey's post-hoc test, *P < 0.05, **P < 0.01, ***P < 0.001 vs NG, #P < 0.05 vs HG24 h, &P < 0.05 vs HG48 h; D: Statistical results of Hoechst33342 staining positive cells, n = 3, One-way Anova with Turkey's post-hoc test, *P < 0.05, **P < 0.01,***P < 0.001 vs NG, #P < 0.05 vs HG24 h, &P < 0.05 vs HG48 h; E: Western Blot representative images of Bcl-2, Bax and cl-Caspase3; F: Statistical results of expression levels of Bcl-2, Bax, Cleaved Caspase3 protein, n = 3, One-way Anova with Turkey's post-hoc test, *P < 0.05, **P < 0.01,***P < 0.001 vs NG,# P < 0.05,##P < 0.01 vs HG24 h, &P < 0.05 vs HG48 h; G. Statistical analysis of Caspase 3 activity results in each group of cells, n = 4, One-way Anova with Turkey's post-hoc test, **P < 0.01,***P < 0.001 vs NG,# P < 0.05 vs HG24 h, &P < 0.05 vs HG48 h. Data are presented as the means ± SEMs.
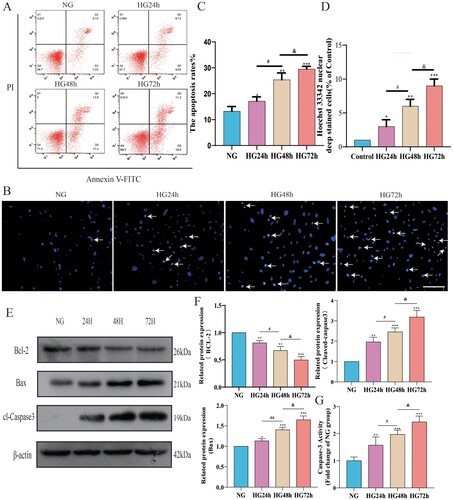
Figure 6. The mitochondrial ROS content of pericytes increases in a time-dependent manner in a high-glucose environment. A: Representative fluorescent image of Mitosox, Scale bar = 50 μm; B: Representative flow cytometry image combining Mitosox; C: Statistical analysis of mitochondrial ROS content, n = 3, One-way Anova with Turkey’s post-hoc test, *P < 0.05, **P < 0.01, ***P < 0.001 vs NG, #P < 0.05 vs HG24 h, &P < 0.05 vs HG48 h. Data are presented as the means ± SEMs.
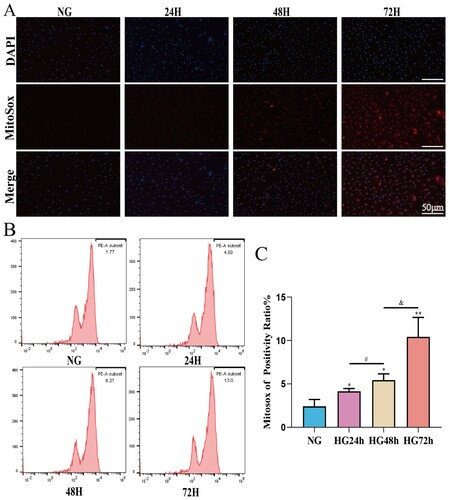
Figure 7. High glucose can lead to a decrease in mitochondrial membrane potential in pericytes and this decrease is time-dependent. A: Representative fluorescent image of JC-1, Scale bar = 50 μm; B: Representative flow cytometry image combining Mitosox; C: Statistical analysis of mitochondrial membrane potential, n = 3, One-way Anova with Turkey’s post-hoc test, *P < 0.05, **P < 0.01, ***P < 0.001 vs NG, ##P < 0.01 vs HG24 h, &P < 0.05 vs HG48 h. Data are presented as the means ± SEMs.
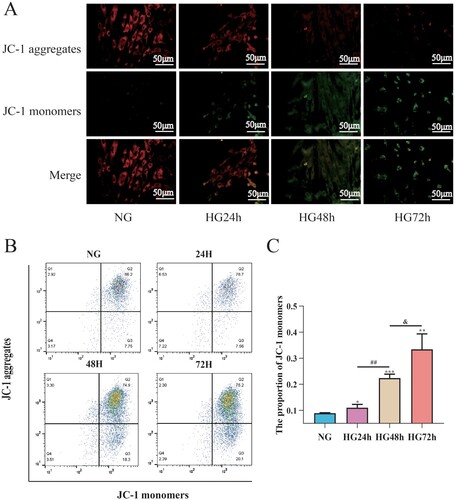
Figure 8. Oxidative stress induced by high glucose mediates the expression changes of CytC/AIF between the cytoplasm and mitochondria. A: Representative Western blot images of CytC and AIF in the cytoplasm and mitochondria of pericytes cultured under high glucose; B: Representative Western blot images of CytC and AIF in the cytoplasm and mitochondria of pericytes cultured under high glucose with NAC supplementation; C: Quantitative analysis of CytC and AIF expression in the cytoplasm and mitochondria of pericytes cultured under high glucose, n = 3, One-way Anova with Turkey’s post-hoc test, *P < 0.05, **P < 0.01, ***P < 0.001 vs NG, #P < 0.05 vs HG24 h, &P < 0.05 vs HG48 h; D: Quantitative analysis of CytC and AIF expression in the cytoplasm and mitochondria of pericytes cultured under high glucose with NAC supplementation, n = 3, One-way Anova with Turkey’s post-hoc test, *P < 0.05, **P < 0.01 vs NG, #P < 0.05 vs HG. Data are presented as the means ± SEMs.
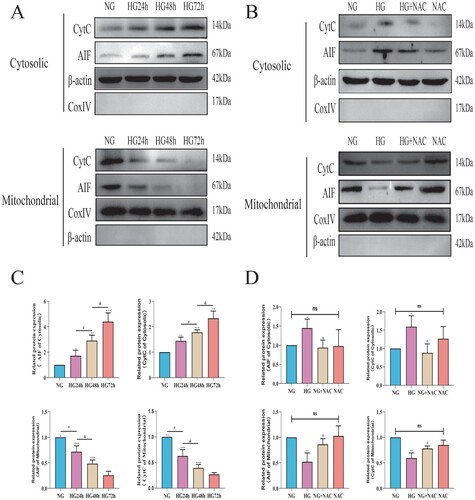
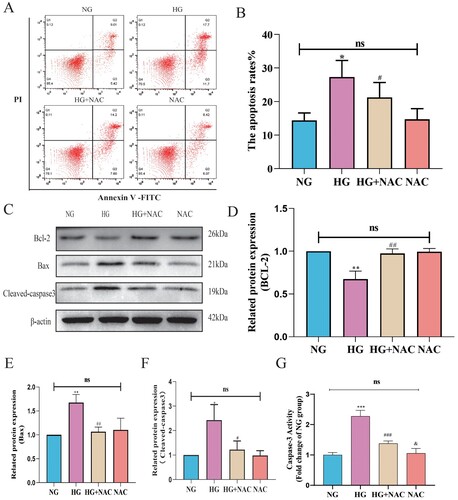
Figure 9. High glucose induces pericyte apoptosis through the mitochondrial pathway mediated by oxidative stress involving CytC/AIF. A:Representative images of FITC-PI flow cytometry; B: Statistical analysis of the percentage of apoptotic cells by flow cytometry, n = 3, One-way Anova with Turkey’s post-hoc test, *P < 0.05 vs NG, #P < 0.05 vs HG; C: Representative Western Blot images of Bcl-2, Bax, and cleaved-Caspase3; D: Statistical analysis of Bcl-2 protein expression level, n = 3, One-way Anova with Turkey’s post-hoc test, **P < 0.01 vs NG, ##P < 0.01 vs HG; E: Statistical analysis of Bax protein expression level, n = 3, One-way Anova with Turkey’s post-hoc test, **P < 0.01 vs NG, ##P < 0.01 vs HG; F: Statistical analysis of cleaved-Caspase3 protein expression level, n = 3, One-way Anova with Turkey’s post-hoc test, *P < 0.05 vs NG, #P < 0.05 vs HG, h; G. Statistical analysis of Caspase 3 activity results in each group of cells, n = 4, One-way Anova with Turkey's post-hoc test, ***P < 0.001 vs NG,### P < 0.05 vs HG, &P < 0.05 vs HG + NAC. Data are presented as the means ± SEMs.
Supplemental Material
Download MS Word (306.3 KB)Data availability statement
The data that support the findings of this study are available from the corresponding author upon reasonable request.