
Figures & data
Figure 1. Hyperoxia exposure reduces the expression of PLAGL2, HIF-1α, VEGF, and SPC. (A) Immunofluorescence staining revealed that the expression of PLAGL2 and HIF-1α in lung tissues of the CON group was higher compared to the corresponding HYPEROXIA group on the 3rd day, 7th day, and 14th day. (B) Western blot analysis was performed to assess the protein expression levels of HIF-1α, VEGF, and SPC. The protein expression levels of HIF-1α, VEGF, and SPC were significantly decreased after hyperxoia exposure compared to the CON group. Statistical significance was determined as *p < 0.05, **p < 0.01, ***p < 0.001.
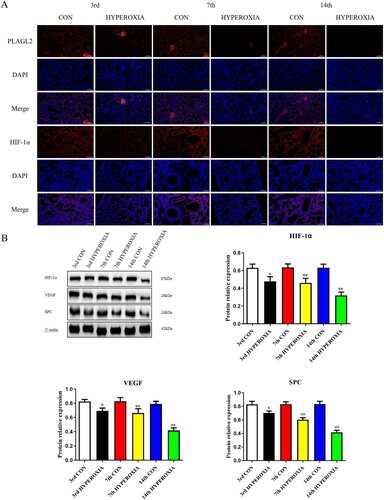
Figure 2. Upregulation of PLAGL2 can restore the migration ability of AECII cells inhibited by hyperoxia. (A)Representative images of wound healing assay for ACEII cells at 24 and 48 h. Red lines indicate the leading edge of the migrating cells (magnification × 40). (B)Migration of ACEII cells was tested and the distance of the wound was calculated up to 48 h. Compared with CON group. *p < 0. 05, **p < 0. 01, ***p < 0. 001 was considered statistically significant.
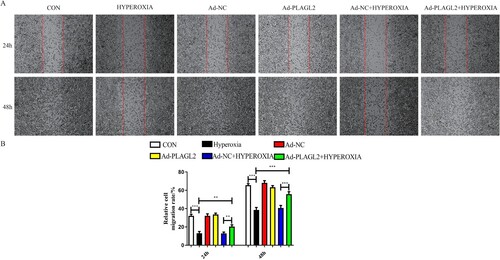
Figure 3. demonstrates that upregulation of PLAGL2 can attenuate the inhibitory effect of hyperoxia on AECII cell proliferation. (A) CCK-8 assay showed that the proliferation capacity was restored in the Ad – PLAGL2 + HYPEROXIA group compared to the HYPEROXIA group. (B) EDU assay was performed to assess cell proliferation, and it revealed enhanced proliferation ability of AECII cells after upregulating PLAGL2. Statistical significance was determined as *p < 0.05, **p < 0.01, ***p < 0.001.
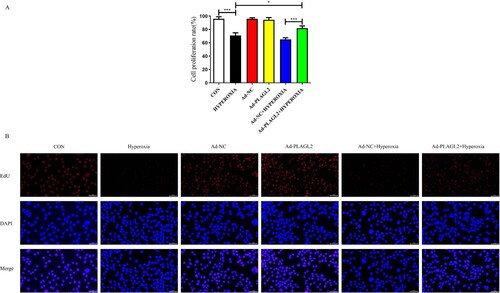
Figure 4. Upregulation of PLAGL2 activates the HIF-1α/VEGF signaling pathway in AECII cells. (A) Upregulation of PLAGL2 increased the mRNA expression of genes related to the HIF-1α/VEGF signaling pathway. (B) Western blot analysis revealed that upregulation of PLAGL2 enhanced the protein expression of the HIF-1α/VEGF signaling pathway. Statistical significance was determined as *p < 0.05, **p < 0.01, ***p < 0.001.
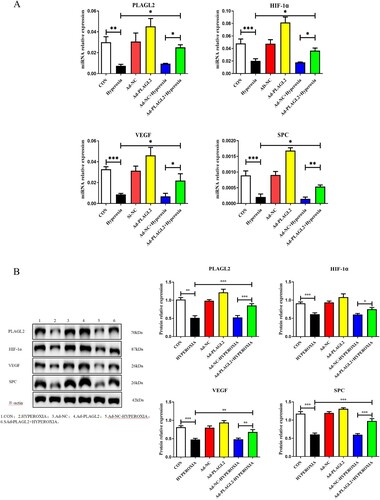
Figure 5. Flow cytometry detects apoptosis in AECII cells. (A) Upregulation of PLAGL2 can alleviate hyperoxia-induced apoptosis in AECII cells. (B)Quantitative analysis of apoptotic cell percentages. Percentage of cell apoptosis = Q2 (early apoptosis) + Q4 (late apoptosis). *p < 0. 05, **p < 0. 01, ***p < 0. 001 was considered statistically significant.
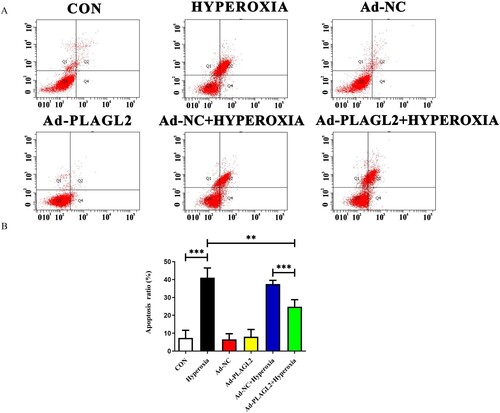
Figure 6. PLAGL2 inhibits ferroptosis in AECII cells. (A) AECII cells were stained using the Calcein AM staining kit. (B) Ad-NC and Ad-PLAGL2 AECII cells were treated with DMSO and erastin for 8 hours. Cell viability was examined through Trypan blue staining. *p < 0. 05, **p < 0. 01, ***p < 0. 001 was considered statistically significant.
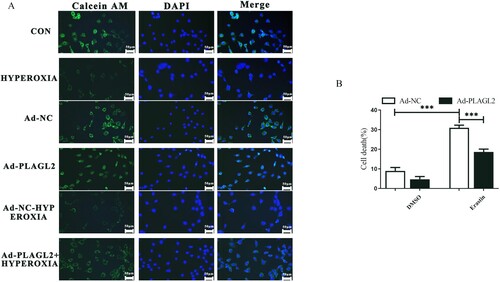
Figure 7. Exposure to hyperoxia inhibits the expression levels of PLAGL2 in AECII cells, which in turn suppresses the HIF-1α/VEGF signaling pathway and leads to cellular apoptosis and ferroptosis.
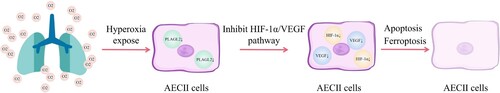
Table 1. Sequences of the real-time PCR primers.