Figures & data
Figure 1. Popular elections and cabinet survival under different regime types. Source: Åberg and Sedelius.Footnote 31
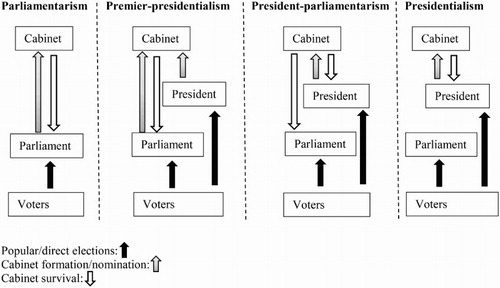
Table 1. Study sample of countries under different regime types 2011.
Figure 2. Presidential power and regime type. Source: Doyle and Elgie, “Maximizing the Reliability of Cross-National Measures of Presidential Power”. Comment: A one-way ANOVA was conducted to determine if presidential power was significantly different for the different regime types. There was a significant difference between groups as determined by one-way ANOVA [F(3,104) = 16.64, p = 0.0000]. A Tukey post-hoc test showed that presidential power was significantly higher in the president-parliamentary group compared to the premier-presidentalism group (0.219 ± 0.052, p = 0.000). However, the difference between premier-presidentalism and parliamentarism was not statistically significant (0.070 ± 0.055, p = 0.584).
![Figure 2. Presidential power and regime type. Source: Doyle and Elgie, “Maximizing the Reliability of Cross-National Measures of Presidential Power”. Comment: A one-way ANOVA was conducted to determine if presidential power was significantly different for the different regime types. There was a significant difference between groups as determined by one-way ANOVA [F(3,104) = 16.64, p = 0.0000]. A Tukey post-hoc test showed that presidential power was significantly higher in the president-parliamentary group compared to the premier-presidentalism group (0.219 ± 0.052, p = 0.000). However, the difference between premier-presidentalism and parliamentarism was not statistically significant (0.070 ± 0.055, p = 0.584).](/cms/asset/3868f916-261c-4d6b-8cd0-b25a35fbc4fb/fdem_a_1334643_f0002_b.jpg)
Figure 3. Democratic Performance by Regime Type. Comment: Bars represent means. All variables have been rescaled into a scale ranging from 0 to 1. N = 145. In order to test the statistical significance of the differences, a series of one-way ANOVAs were conducted. All ANOVAS were significant (p < 0.000). A Tukey post hoc test showed that for all democratic performance variables, there is a statistically significant difference between premier-presidentialism and president-parliamentarism (p <0 .01).
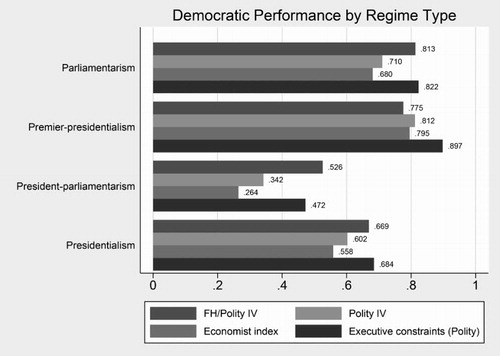
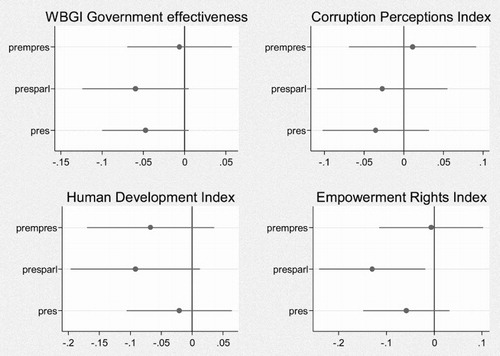
Figure 4. Government performance by regime type. Comment: Bars represent means. CPI = Corruption Perceptions Index, HDI = Human Development Index. All variables have been rescaled into a scale ranging from 0 to 1. N for Government effectiveness = 171, CPI = 159, Empowerment rights index = 173, HDI = 167. In order to test the statistical significance of the differences, a series of one-way ANOVAs were conducted. All ANOVAS are significant (p < 0.01). A Tukey post hoc test shows no significant differences between premier-presidentialism and president-parliamentarism. The most consistent difference is the one between parliamentarism and president-parliamentarism, which is statistically significant on all government performance variables (p <0 .05). There is also a significant difference (p <0 .01) between parliamentarism and presidentialism on all variables with the exception of the empowerment rights index (p =0 .08).
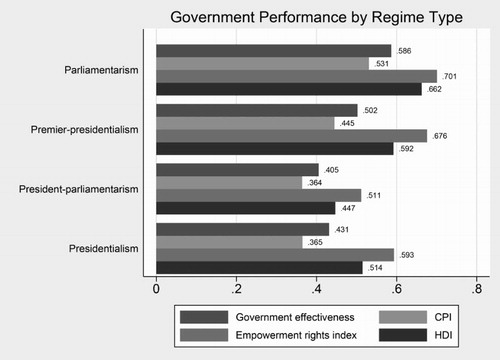
Figure 5. Regime types and democratic performance (OLS coefficients with 95% confidence intervals). Comment: The graphs are based on the regressions presented in (appendix). Parliamentarism is used as the reference category.
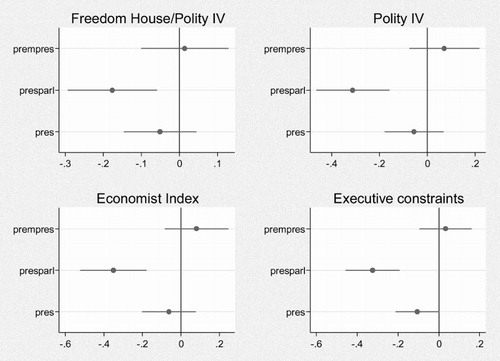
Figure 6. Regime types and government performance (OLS coefficients with 95% confidence intervals). Comment: The graphs are based on the regressions presented in (appendix). Parliamentarism is used as the reference category.