Figures & data
Figure 1. Autocratization as democratization in reverse.
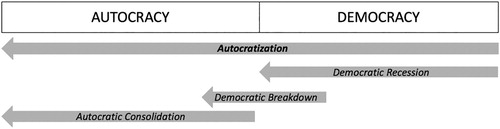
Figure 2. The three waves of autocratization.
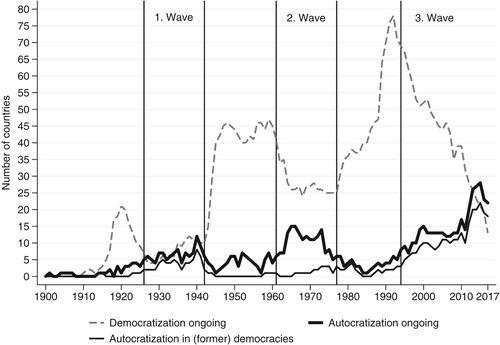
Figure 3. Types of autocratization of democracies.
Note: 28 episodes are included in the pre-third wave period, and 47 in the third wave.
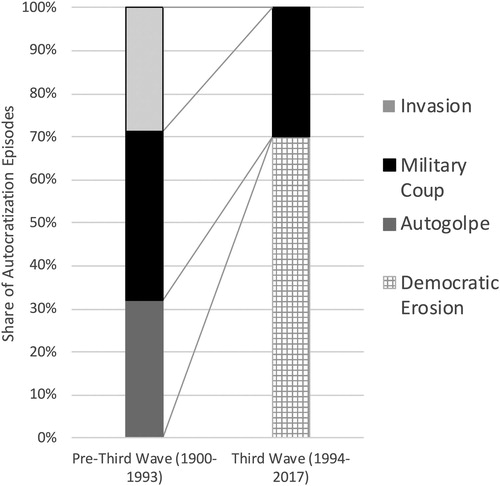
Figure 4. Global trend rate of autocratization in democracies and share of democracies.
Note: The autocratization rate captures how fast the V-Dem Electoral Democracy Index declines at the peak of the autocratization episode in terms of changes from one year to the other. High values indicate sudden autocratization and low values more gradual. The x-axis of the figure shows the year where the peak of the autocratization rate occurred during the episode.
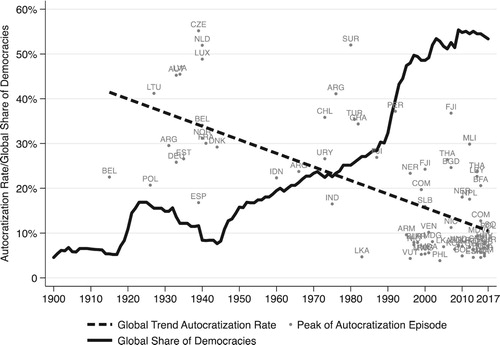
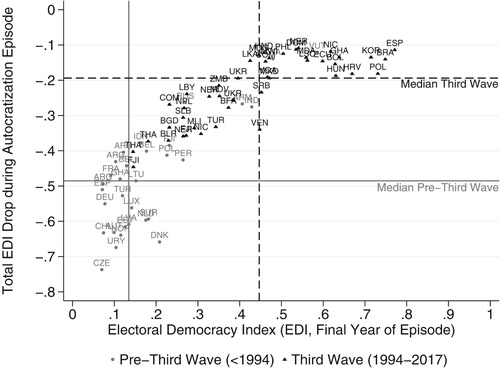
Figure 5. The consequences of autocratization on the level of democracy.