Figures & data
Table 1. Summary of survey waves.
Table 2. Descriptives of all variables.
Figure 1. Electoral trust in the pre- and post-electoral wave.
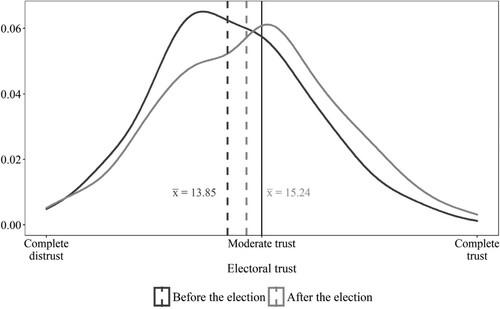
Figure 2. Change in electoral trust.
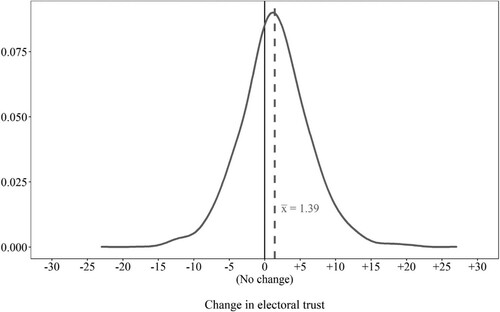
Table 3. Overview of the evolution of electoral perception beliefs.
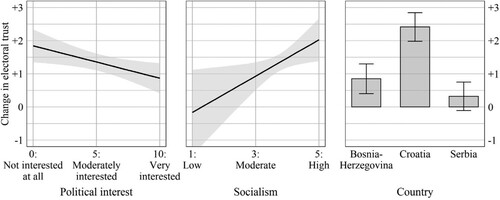
Figure 3. Marginal effects of the main explanatory variables change in electoral trust. Note: Predicted probabilities are based on the results of Model 3, Table 4; all other variables are kept at their mean value; the grey area represents the 95% confidence interval.
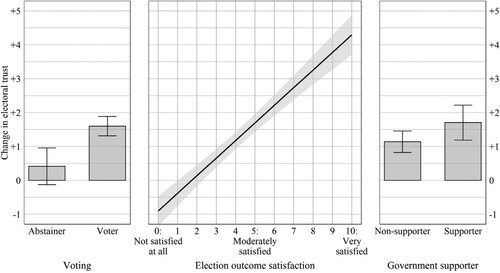
Table 4. Analyses of change in electoral trust.
Figure 4. Marginal effects of the control variables on change in electoral trust. Note: Predicted probabilities are based on the results of Model 3, Table 4; all other variables are kept at their mean value; the grey area represents the 95% confidence interval.