Figures & data
Figure 1. Limited statehood in Libya and Tunisia. Source: Author’s illustration. Based on statehood data by Stollenwerk and Opper, The Governance and Limited Statehood Dataset.
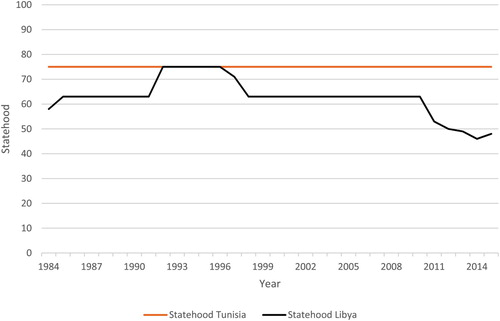
Figure 2. Order contestation in Libya and Tunisia. Source: Author’s illustration. Based on ACLED data for protests and riots, https://acleddata.com.
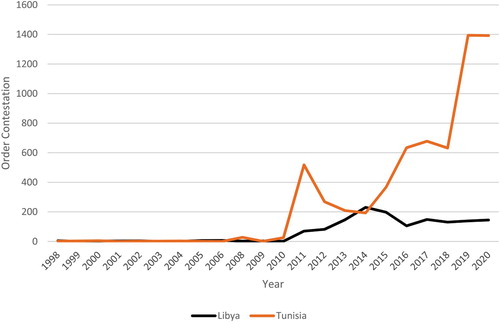
Table 1. Descriptive statistics Libya and Tunisia.
Figure 3. Resilience in Libya and Tunisia. Source: Author’s illustration.
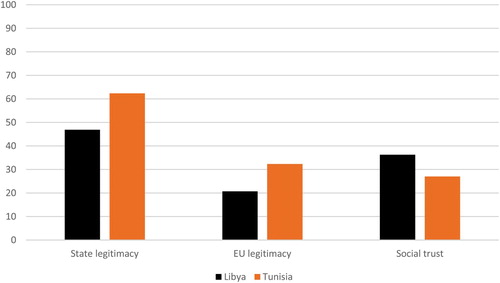
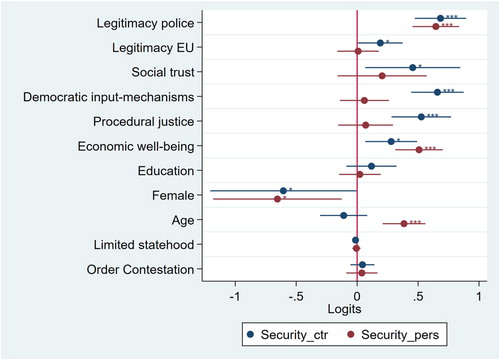
Table 2. Multilevel models Tunisia and Libya.
Figure 4. Comparing aspects of (in-)security in Libya and Tunisia. Source: Author’s illustration. Note: Violent event and deaths data come from ACLED for the year 2019. The data for perceptions of (in-)security come from the original surveys in Libya and Tunisia evaluated in this study. The right hand y-axis shows the percentages of individuals feeling insecurity and the left hand y-axis absolute counts of violent events/deaths.
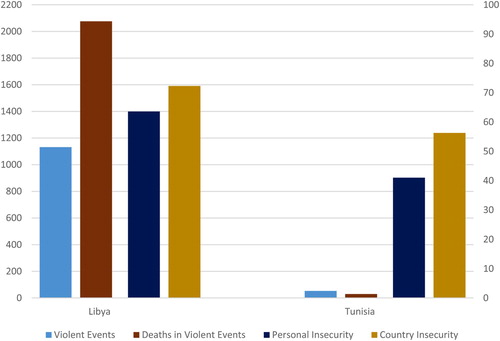
Figure 5. Analysing security perceptions in Tunisia. Source: Author’s illustration.
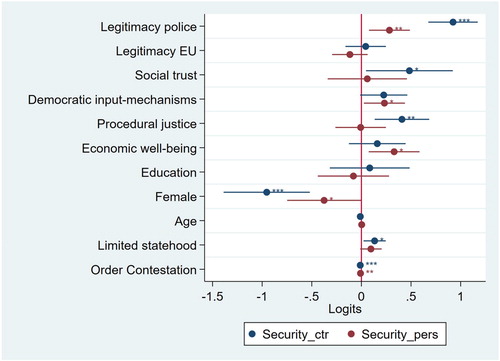
Figure 6. Analysing security perceptions in Libya. Source: Author’s illustration.