Figures & data
Figure 1. Liberal Democracy Index, global and regional averages, 1971–2021. Note: The grey area marks the confidence intervals. The left panel is based on conventional country averages. The right-hand panel shows average levels of democracy weighted by population sizes.
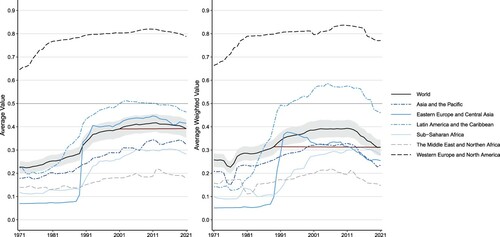
Figure 2. Number of countries and share of population by regime type, 1971–2021. Note: plots the number of countries (left-hand panel) and the share of the world’s population (right-hand panel), by regime type.
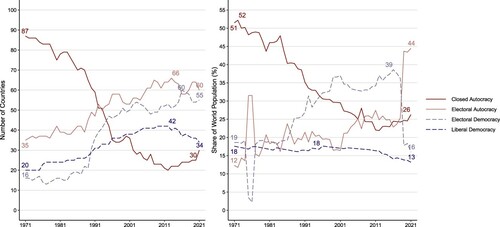
Figure 3. Democratic aspects improving and declining, 2011 vs. 2021. Note: shows the number of countries improving and declining significantly and substantially for different components of democracy, over a ten year period. The left panel compares changes from 2001 to 2011 and the right panel compares changes from 2011 to 2021.
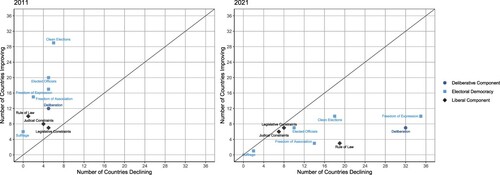
Figure 4. Top 20 declining indicators, 2011–2021.
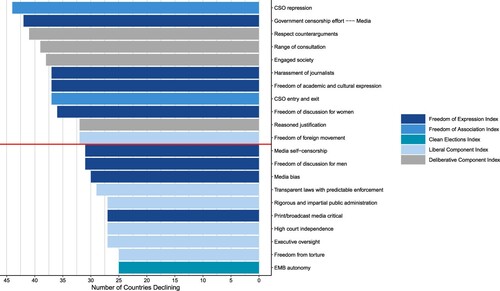
Figure 5. Autocratizing vs. democratizing countries, 1971–2021. Note: shows patterns of democratization and autocratization over the last 50 years. The left-hand panel displays the number of countries in each category and the right-hand panel shows the share of the world population living in autocratizing or democratizing countries.
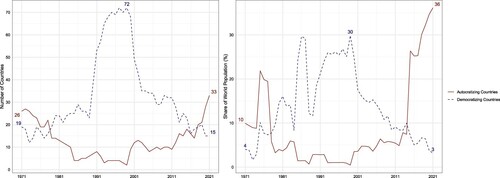
Figure 6. Advances vs. declines on the Liberal Democracy Index (LDI), 2011–2021. Note: Country names are highlighted if the difference between 2011 and 2021 is significant and substantial.
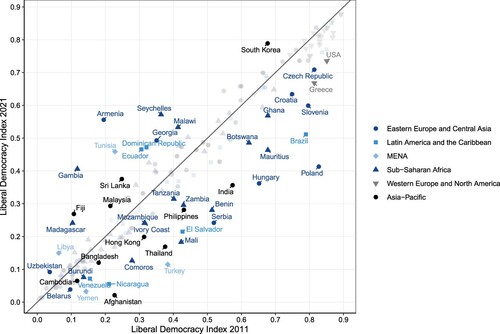
Figure 7. Top 10 democratizing vs. autocratizing countries (10-year). Note: plots values of the Liberal Democracy Index (LDI) for the 10 countries with the highest amount of LDI increase (left panel) and decrease (right panel) in the last 10 years.
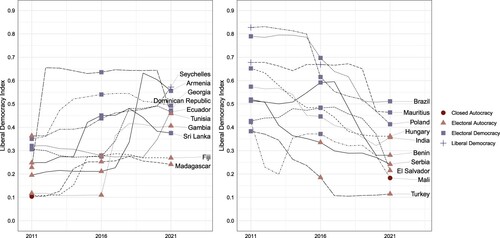
Figure 8. Top 10 democratizing vs. autocratizing countries (3-year). Note: plots values of the Liberal Democracy Index (LDI) for the 10 countries with the highest amount of LDI increase (left panel) and decrease (right panel) in the last 3 years. Markers and colour indicate each country’s regime type on the regimes of the world index.
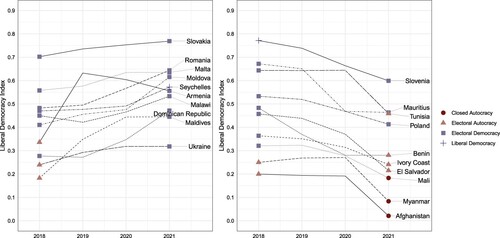
Figure 9. Mobilization and autocratization, 1971–2021.
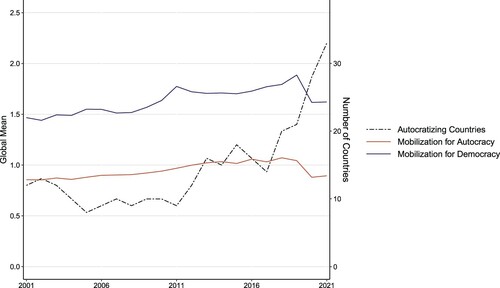
Figure 10. Increasing vs. decreasing political polarization, 2011–2021. Note: Countries are labelled if the difference between 2011 and 2021 was statistically significant and substantially meaningful.
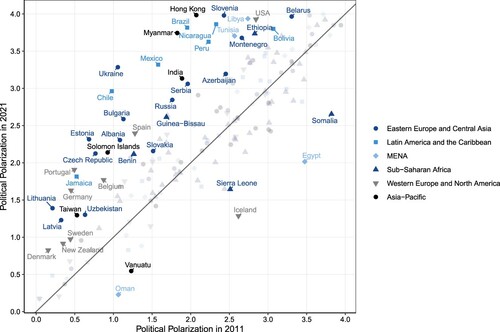
Figure 11. Polarization in top autocratizing countries with anti-pluralist ruling parties, 2006–2021. Note: The left y-axis displays the score for Political Polarization, Government Disinformation (Domestic and Abroad), and Political Parties Hate Speech. All scores except for Political Polarization, have been reversed to mean that higher equals more. The right y-axis represents the scale for the LDI (0–1). The vertical line shows the year the anti-pluralist party came into power.
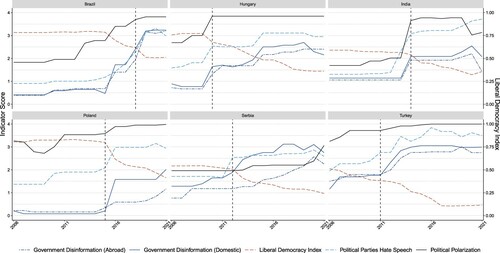
Table 1. Effects of polarization and anti-pluralist ruling parties on democracy and misinformation.
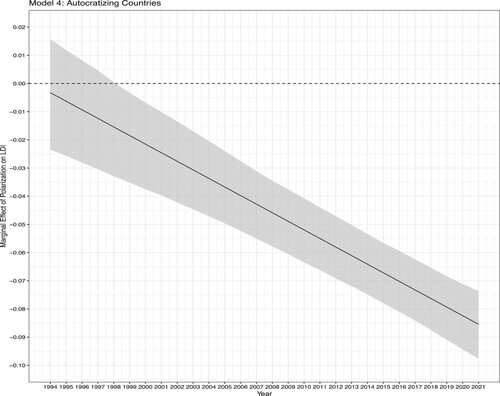
Figure 12. Marginal effects, Model 4 in .
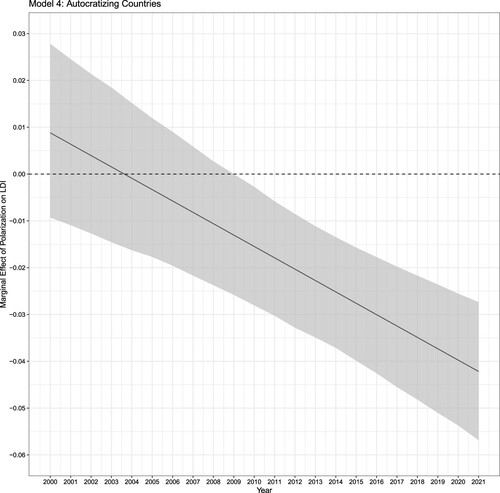
Figure 13. Government dissemination of false information in 2021. Note: Extent to which governments and their agents use social media to disseminate misleading viewpoints or false information to influence their own population (x) as well as citizens of other countries (y). The lines are fitted lines with 95% confidence intervals for autocracies and democracies, respectively.
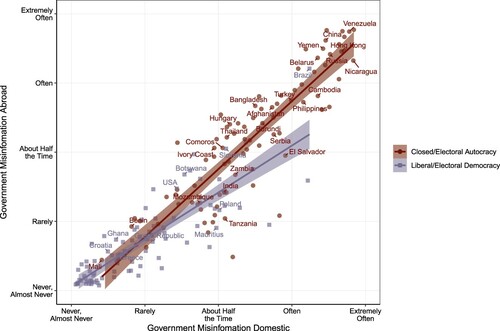
Figure 14. Government dissemination of false information, 2001–2021. Note: Extent to which governments and their agents use social media to disseminate misleading viewpoints or false information to influence their own population (left) as well as citizens of other countries (right). Values are regional averages.
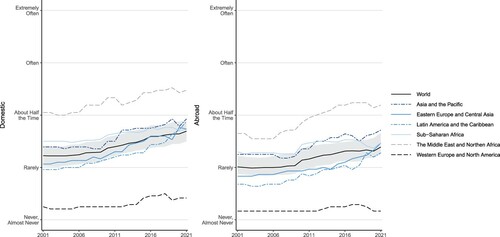
Figure 15. The Russian government’s dissemination of false information, 2011–2021.
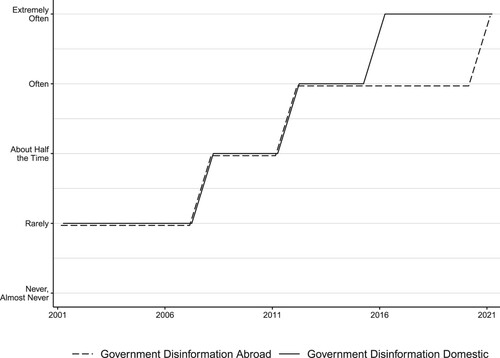
Figure A1. State of Liberal Democracy in 2021.
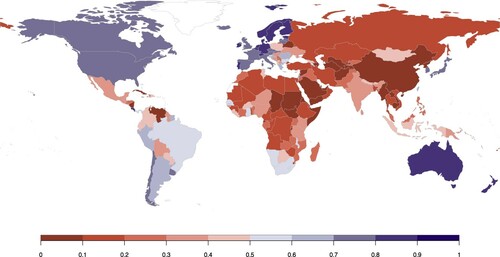
Figure A2. Changes in democratizing countries, by region. Notes: plots average change in democracy components in countries that were democratizing between 2011 and 2021. Democratizing countries are those with significant and substantial improvement on V-Dem’s liberal democracy index (LDI) during this 10-year period.
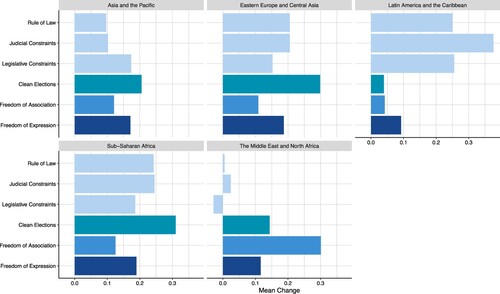
Figure A3. Declines in autocratizing countries, by region. Notes: plots average change in democracy components in countries that were autocratizing between 2011 and 2021. Autocratizing countries are those with significant and substantial decline on V-Dem’s Liberal Democracy Index (LDI) during this 10-year period.
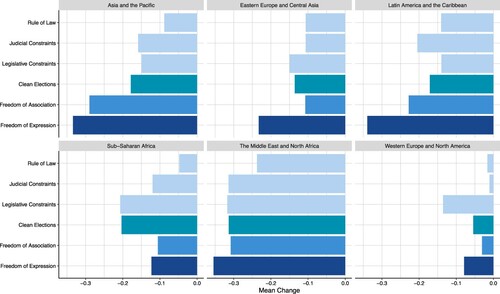
Figure A4. Countries democratizing vs. autocratizing, 2011–2021. Notes: shows where the LDI has improved (blue) or declined (red) substantially and significantly over the past decade. Countries in grey had no substantial and significant change on the LDI during this period.
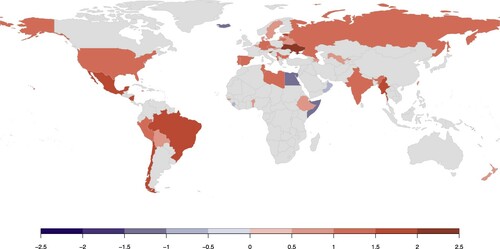
Figure A5. Autocratization in the EU and its Eastern neighbours. Notes: shows where the liberal democracy index (LDI) substantially and significantly improved (blue) or declined (red) over the past decade. Countries in grey had no substantial and significant change on the LDI during this period.
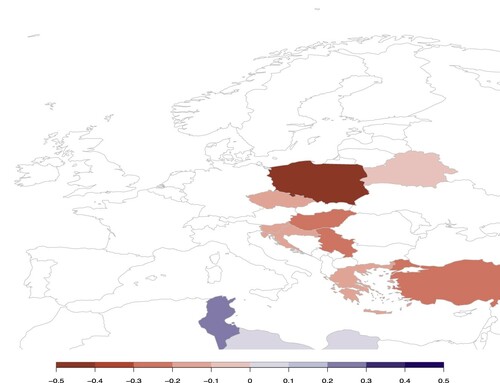
Table A1. Effects of polarization and anti-pluralist parties on democracy and misinformation (ERT).
Figure A6. Mobilization for Democracy in 2021. Notes: shows the countries in which large-scale pro-democracy protests took place in 2021 and relates that level to whether the country was democratizing, autocratizing, or stable compared to ten years ago based on the LDI. The indicator of mass mobilization for democracy captures the extent to which events with pro-democratic aims have been frequent and large. Horizontal lines stand for the mean of the level of mobilization in each category.
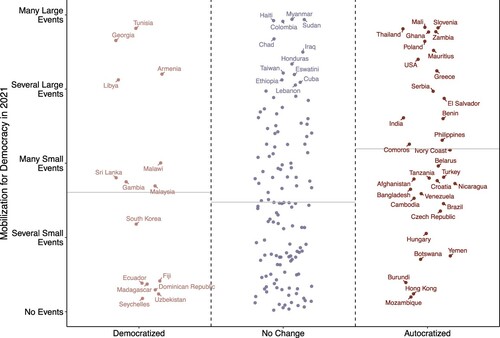
Figure A7. Mobilization for Autocracy in 2021. Notes: shows the countries in which large-scale pro-autocracy protests took place in 2021 and relates that level to whether the country was democratizing, autocratizing, or stable compared to ten years ago based on the LDI. The indicator of mass mobilization for autocracy captures the extent to which events with pro-autocratic aims have been frequent and large. Horizontal lines stand for the mean of the level of mobilization in each category.
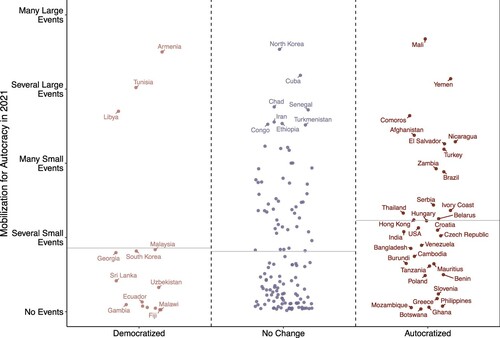
Figure A8. Countries with changes on political polarization, 2011–2021. Notes: Red marks countries where political polarization increased substantially and significantly over the past ten years. Blue marks countries where the level of polarization decreased. Countries in grey are unchanged.

Figure A9. Government dissemination of false information. Notes: shows two variables from the Digital Society Project that measure how often governments and their agents use social media to disseminate misleading viewpoints or false information to influence their own population (left) as well as citizens of other countries (right). The value shown is the average values of the RoW.
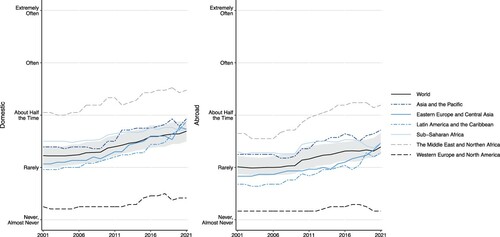
Figure A10. Marginal effects, Model 4 in (ERT).