
Figures & data
Figure 1. Political arrests, offline and online contention.
Note: The protest event catalog was collected by the Open Data Tank Initiative e.V and contains records for 21,713 protests hand-coded from Arabic-language news and social media sources. The arrest data is an updated version of the WikiThawra dataset sourced from court records, local news reports, and social media postings (https://opendatatank.org/; https://wikithawra.wordpress.com). The historical Twitter data was retrieved using the Twitter academic API (Barrie and Chun-ting Ho, “academictwitteR”).
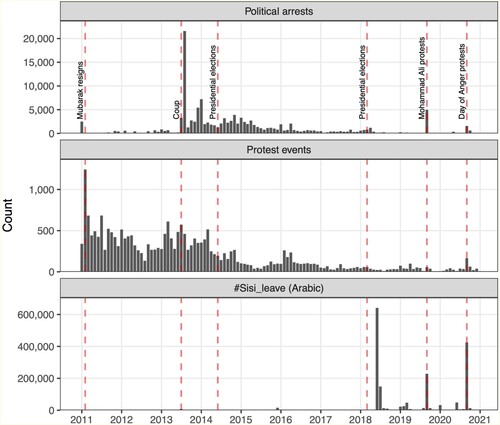
Figure 2. Off- and online contention in September 2020.
Note: The protest data is from the same catalog collected by the Open Data Tank Initiative e.V. Anti-regime tweets retrieved by the authors.
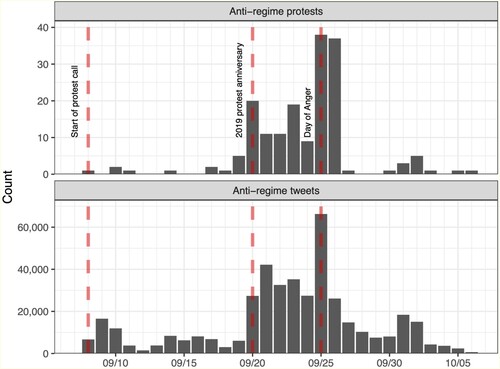
Figure 3. Percentage of hours with at least one anti-regime hashtag trending in the top 5 hashtags per day during our analysis period.
Note: Data retrieved from getdaytrends.com.
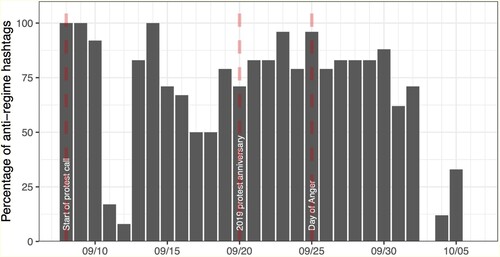
Table 1. Empirical tests.
Figure 4. Proportion of anti-regime tweets by the number of followers relative to overall tweets.
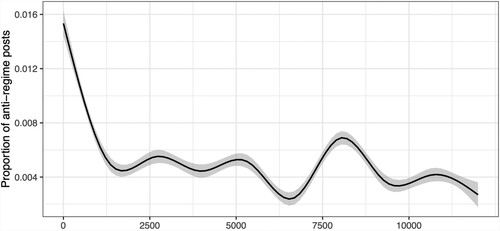
Figure 5. Proportion of anti-regime tweets by anti-regime user.
Note: Accounts that posted anti- and pro-regime posts were disregarded. We took the number of followers at the beginning of the study period.
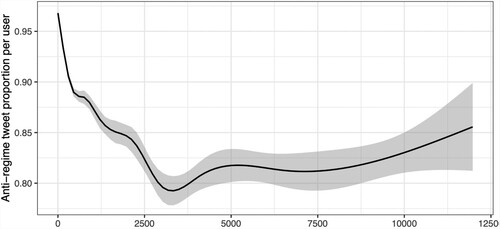
Figure 6. Account creation dates.
Note: Kolmogorov–Smirnov D statistics 0.171 (2006–2020), 0.142 (2019–2020), 0.147 (August–October 2020). All D statistics significant at p < .001.
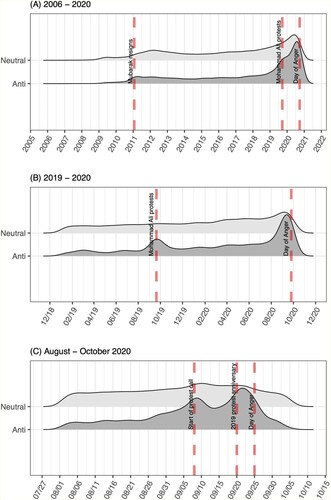
Figure 7. Share of users without forename and surname.
Note: 95% confidence intervals are displayed.
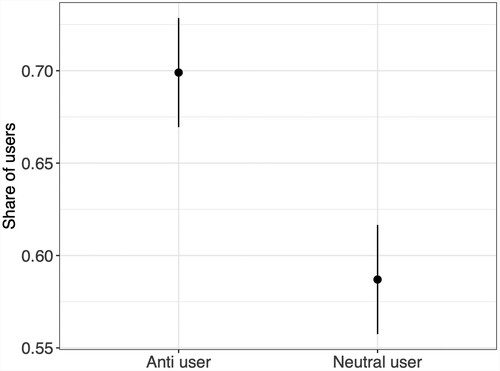
Table 2. Random and fixed effects models predicting if users delete a tweet or quoted retweet.
Figure 8. Proportion of anti-regime tweets depending on the number of followers and a breaking point at the 5000 follower threshold.
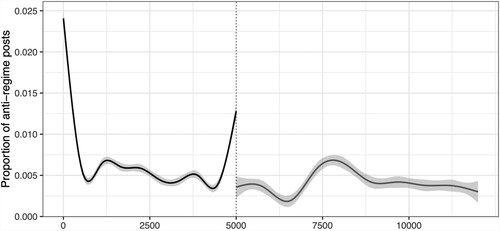
Table 3. Percentage of retrieved accounts with followers between 4800 and 5000 in September 2020 that stayed below the 5000 follower threshold in March 2021.
lutscher_ketchley_online_appendix.pdf
Download PDF (1.7 MB)Data availability statement
Due to the sensitive data used in this paper, we anonymized all information that could be used to identify specific tweets or users. Aggregated replication data can be obtained via request; see supplementary material for more details.