Figures & data
Table 1. Existence of functionalities – in the webpages of participatory processes – which can favour a friendly access to some minorities/traditionally under-represented groups.
Table 2. Social groups at risk of underrepresentation which are considered easier or most difficult to reach through specific inclusion strategies (Q10; Q11).
Table 3. ‘Why the usually under-represented groups listed in are easier to reach?’ (Main Clusters deduced from Q10.4.).
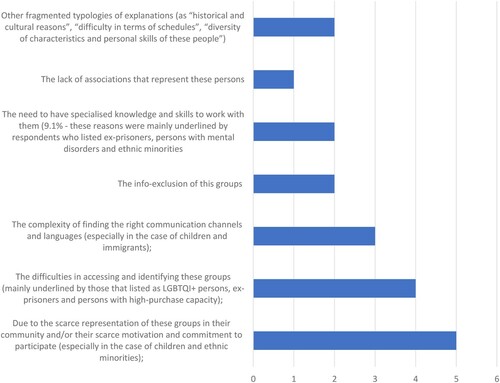
Figure 1. ‘Why the usually under-represented groups listed in are more difficult to reach?’ – Interpretation and clustering of main answers (N = 19).