Figures & data
Table 1. Summary statistics of monthly hedge fund returns.
Table 2. Statistical evaluation – Theil's U.
Table 3. Economic evaluation – CER.
Table 4. Out-of-sample performance of top expected return portfolios.
Table 5. Out-of-sample performance of top t-statistics portfolios.
Table 6. Crisis period – out-of-sample performance of top expected return portfolios.
Table 7. Crisis Period -Out-of-sample performance of top t-statistics portfolios.
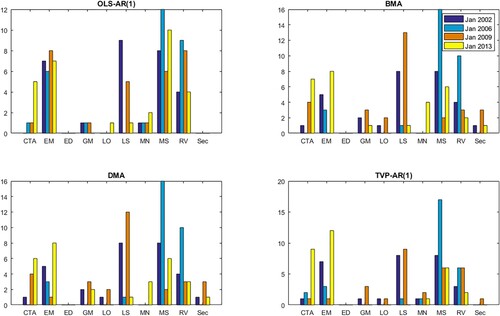
Figure 1. Optimal portfolio composition (expected returns).
Note: The figure shows the composition of portfolios selected based on the forecasted expected value of fund returns in Jan 2002, Jan 2006, Jan 2009 and Jan 2013. Selected models are OLS-AR(1) BMA, DMA and TVP-AR(1).
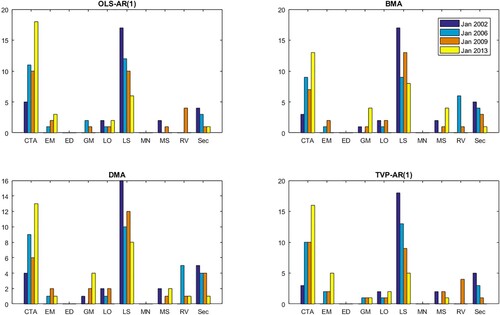
Figure 2. Optimal portfolio composition (t-statistics).
Note: The figure shows the composition of portfolios selected based on t-statistics of expected returns in Jan 2002, Jan 2006, Jan 2009 and Jan 2013. Selected models are OLS-AR(1), BMA, DMA and TVP-AR(1).