
Figures & data
Figure 1. EU ETS allowance price evolution during Phase 3.
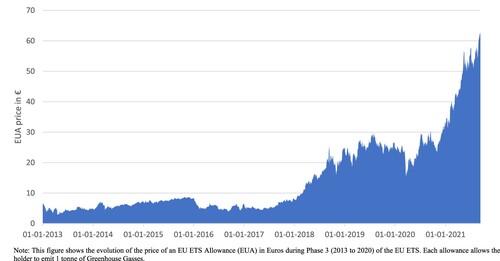
Figure 2. Allocated allowances and verified emissions of sample firms from Phase 1 to Phase 3 of the EU ETS.
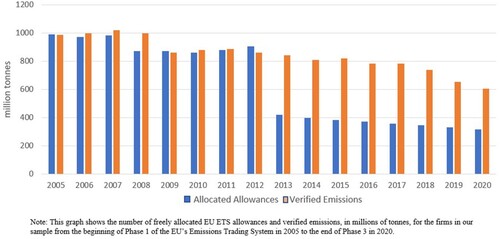
Table 1. Sample firms by industry and country.
Table 2. Description of the Environmental Performance Measures.
Table 3. Performance Measures by Industry.
Table 4. Event Study Results for EU ETS Emissions Verification Event Dates.
Table 5. Absolute and Industry-Relative Environmental Performance.
Table 6. Emissions Reduction Performance Relative to Expectations.