
Figures & data
Figure 1. The evolution of foreign sales and zero leverage. This figure presents the evolution of the median foreign sales ratio (left axis), the number of zero-leverage firm-year observations (right axis), and the number of MNC firm-year observations (right axis) for our sample of UK companies between 1990 and 2018. We define zero-leverage firm-year observations as those when market leverage equals zero. We define MNC firm-year observations as those when the foreign sales-to-total sales ratio exceeds 0.50. We obtain firm identification and accounting data from Bloomberg and foreign sales data from WorldScope.
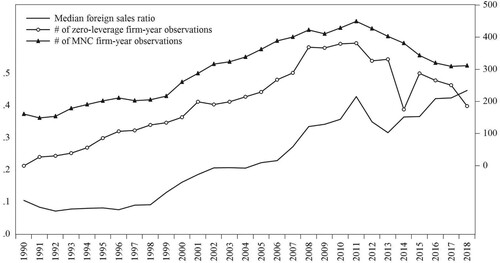
Table 1. Number of firm-year observations for domestic and multinational firms by leverage status.
Table 2. Characteristics of levered and zero-leverage firms by MNC status.
Table 3. Logistic regressions of firms’ zero-leverage status.
Table 4. Logistic regressions of firms’ zero-leverage status: sample subsets.
Table 5. Firm investment and zero leverage.
Table 6. Robustness checks.
Figure 2. Feature importance using random forest classifier. This figure presents results using a Random Forest classifier that evaluates the importance of baseline model variables (features) in discriminating between zero-leverage and levered firms. Feature importance scores are presented on the vertical axis. The features are presented on the horizontal axis and defined in Appendix . and in Table . AUC is the area under the ROC curve.
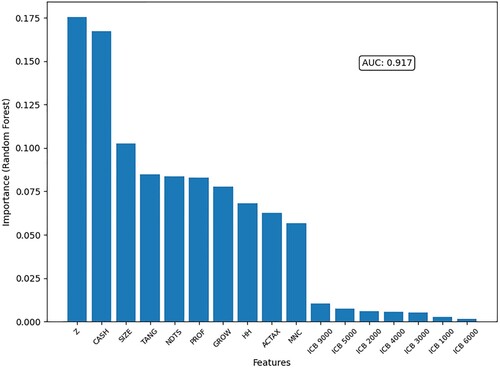
Table A.1. Definitions of Variables and Key Output
