
Figures & data
Figure 1. Conceptual PSM attributes with their hypothesized relationships with arrears (overdue payments).
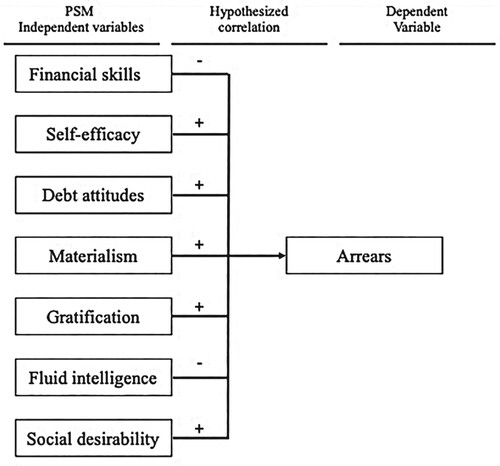
Table 1. Hypotheses model with core literature per PSM attribute.
Table 2. Variable descriptions.
Table 3. Psychometric attributes and their questions.
Table 4. Descriptive data.
Table 5. Overview of correlations between PSM attributes and arrears.
Figure 2. ROC-curve total period (August 2019–February 2022).
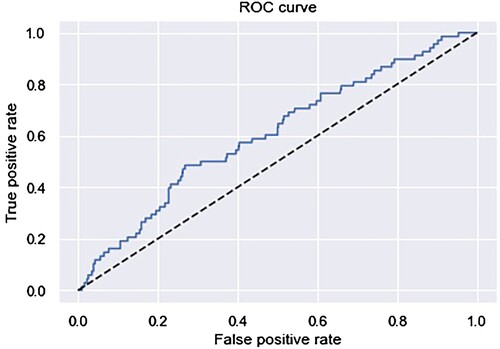
Table 6. Confusion Matrices PSM versus TCSM total period.
Table 7. PSM metrics. Overall, per period and per customer segment.
Figure 3. ROC-curve period of ‘state of emergency’ (March 2020–November 2020).
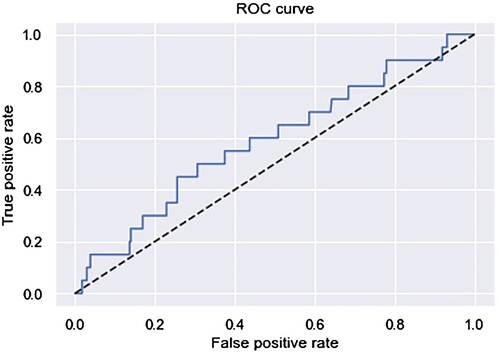
Table 8. Confusion matrices PSM versus TCSM state-of-emergency period.
Table 9. Acceptance rates PSM & TCSM total period and state of emergency period.
Table 10. Default rates PSM & TCSM total period and state-of emergency.
Table 11. Acceptance rates per sector PSM TCSM total period and state-of-emergency.
Table 12. Default rates PSM & TCSM per sector for both periods.
Table 13. Research findings.
