
Figures & data
Table 1. Descriptive information and summary statistics.
Figure 1. Average deposits, loans and other earning assets per year.
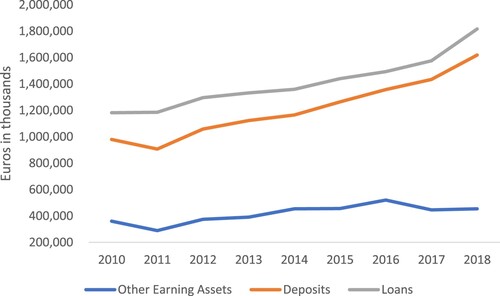
Figure 2. Average loan loss provisions per year.
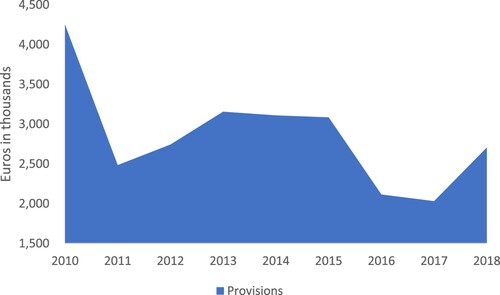
Figure 3. Average NIM per year.
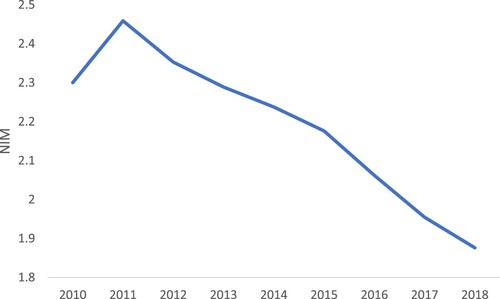
Figure 4. Average non-interest income and profits per year.
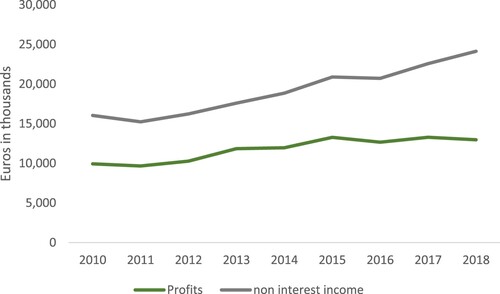
Table 2. Estimated parameters of the Profit efficiency model.
Table 3. Mean profit and cost efficiency per year.
Table 4. Mean elasticities per input price or output.
Table 5. Estimated parameters of the Profit efficiency models.
Table 6. Estimated parameters of the cost inefficiency model.
Table 7. Estimated parameters of the cost efficiency models.