
Figures & data
Figure 1. QE transmission channels.
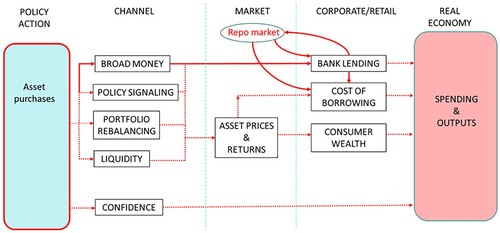
Figure 2. Average daily amounts outstanding of reverse repo in the gilt repo market Source: Bank of England Database: https://www.bankofengland.co.uk/boeapps/database/default.asp. Series codes: YWQZM5L YWQZM5M YWQZM5O YWQZM5P YWQZM5Q YWQZM5R YWQZM5S YWQZM5T YWQZM6E.
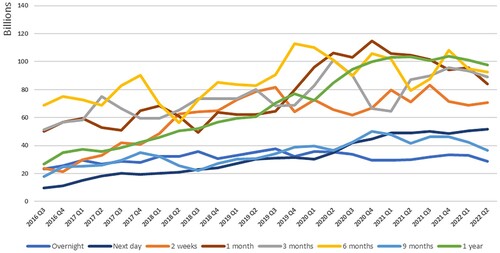
Table 1. Descriptive statistics of the dataset.
Table 2. Propensity score matching (pre Brexit QE).
Table 3. Propensity score matching (pre Covid QE).
Table 4. QE treatment effect – bank-level.
Table 5. QE treatment effect on spreads and amounts of reverse repos – transaction-level.
Table 6. QE treatment effect on spreads and amounts of repos (borrowing) – transaction-level.
Table 7. Synthetic QE treatment effect – reverse repo (lending) amounts and pricing.
Table 8. Alternative QE treatment effect – reverse repo (lending) amounts and pricing.