Figures & data
Figure 1. Most (and least) discriminating words.
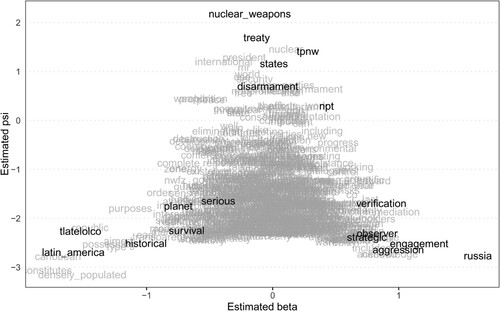
Figure 2. Positions on the TPNW.
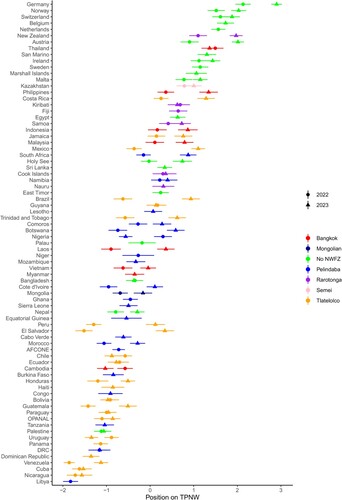
Figure 3. Position on the TPNW across NWFZs and MSPs.
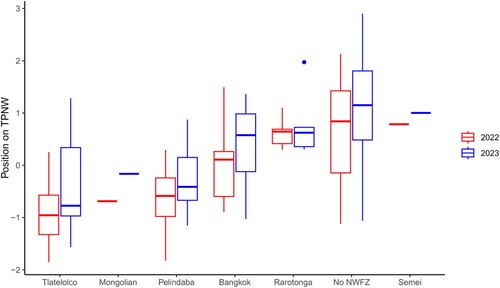
Table 1. Testing the impact of NWFZs against alternative hypotheses.
Table A1. Average and standard deviation by group and year.
Table A2. Description of the variables.
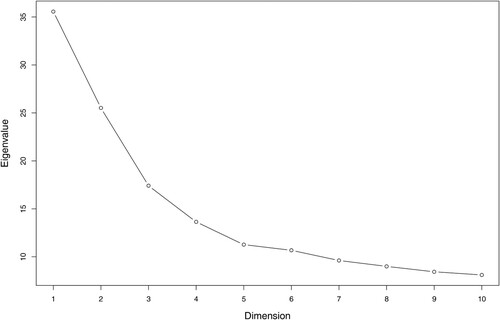
Figure A3. Screeplot.