Figures & data
Table 1. Methods of data collection and analysis performed.
Figure 1. Aerial view of the case study area © Elisa Broccoli.
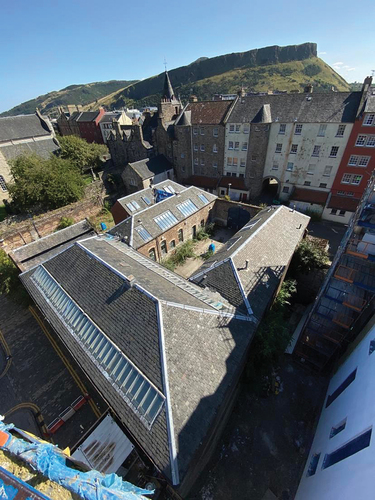
Figure 2. Map of the case study area showing key phases in its historical development © Elisa Broccoli.
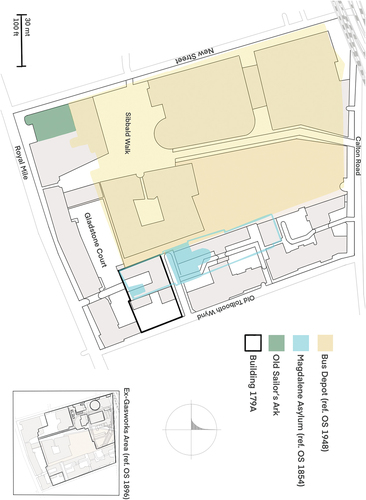
Figure 3. North-east corner pertaining to building 179a in Old Tolbooth Wind. These front elevations are two of the few remaining upstanding structures of the Old Gas Works © Elisa Broccoli.
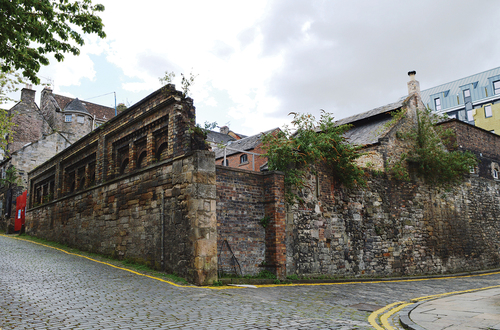
Figure 4. View of the elevation that once served as the main access to the Tolbooth Market © Elisa Broccoli.
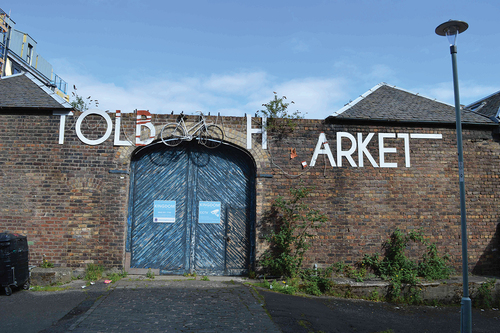
Figure 5. Sentiment changes evidenced via quantitative, lexicon-based analysis of texts associated with 100 photos relevant to the case study and published on Flickr between 2006 and 2021.
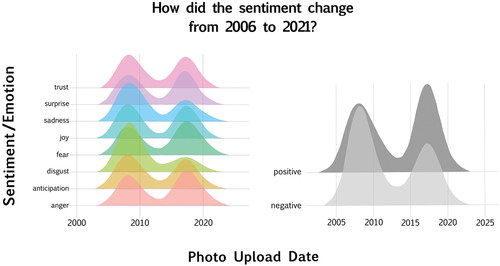
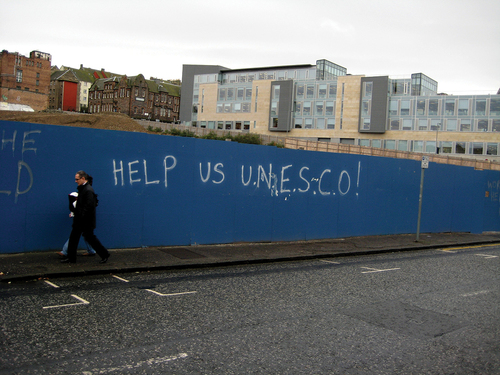
Figure 6. Photo entitled ‘Caltongate’, shared on Flickr. CC BY-NC © Angus Mcdiarmid. https://www.flickr.com/photos/angusmcdiarmid/3026716887/in/photolist-5BsHtV.